PHOTOGRAMMETRIC ENGINEERING & REMOTE SENSING
June 2014
483
I
ntroduction
In the late 1950’s, the Agricultural Board of the National
Research Council was concerned about the impact of insects
and diseases on crops and forests throughout this country
and the world. Therefore, in 1960 a committee
was formed to investigate the potential of aerial
surveys for monitoring insect and disease infes-
tations in agricultural crops and forests (Na-
tional Research Council Committee on Remote
Sensing for Agricultural Purposes, 1970). This
committee was chaired by Dr. J. Ralph Shay,
then Head of the Department of Botany and
Plant Pathology at Purdue University. One of
the key people on the committee was Dr. Robert
N. Colwell, of the Forestry Department, Univer-
sity of California. Bob (Robert) was an expert in
photo interpretation, and was considered to be
“Mr. Remote Sensing” in the United States at
that time, and he played a critical role in the ac-
tivities of the committee. Another key person on
this committee was Marvin Holter, from the In-
stitute of Science and Technology (IST), Univer-
sity of Michigan. He was involved in a research
project called Project Michigan, which was a
classified military project that included work to develop an
instrument called an “optical-mechanical scanner”. Such a
scanner could be flown in airplanes to obtain imagery of the
ground in different wavelength bands of the electromagnet-
ic spectrum. Mr. Holter believed that this optical-mechan-
ical scanner had good potential for assessing agricultural
cover types and conditions. The other committee members
agreed that it would be worth evaluating, and Dr. Shay
suggested that the Agronomy Farm at Purdue had many
species of crops, with detailed “ground truth” information
available, so would be an excellent test site.
At about that same time, NASA was rapidly developing
satellite capabilities and was interested in potential appli-
cations of data that might be obtained from satellites. Thus,
there was a merging of interests – the need for agricultural
information over large geographic areas; the potential util-
ity of multispectral scanner systems; and NASA’s interest
in the potential for utilizing spacecraft for various practical
applications. A proposal was prepared and funded, and in
1964, an optical-mechanical (i.e., “multispectral”) scanner
was flown for the first time over a target that was not pri-
marily of military interest – the Purdue Agronomy Farm.
T
he
F
irst
M
ulti
-S
pectral
D
ata
C
ollection
O
ver
A N
on
-M
ilitary
T
arget
On May 3, 1964 and again on June 25, 1964, two single engine
L-19 high wing airplanes with a system of multispectral scanners
and cameras flew over the Purdue Agronomy Farm. The scan-
ner system actually consisted of two double-ended scanners. One
scanner obtained data in the ultra-violet and thermal infrared
portions of the spectrum and the other scanner collected data
in one thermal and three reflective infrared channels. The data
were recorded onto analog tapes and then imagery was generated
which could be analyzed using photo interpretation techniques
(Figure 1). (Computer analysis capabilities did not exist at that
time.) Because neither of the scanners obtained data in the pho-
tographic portion of the electromagnetic spectrum (0.4 - 0.9 µm),
data in these wavelengths were obtained using a Graflex camera.
However, instead of a standard lens, the front of the camera con-
sisted of a piece of plywood in which nine holes had been drilled
and a small lens inserted into each hole. On top of each lens was
a packet of filters designed to allow only a certain range of wave-
lengths to be transmitted. The imagery for all nine small photos
was recorded on 4 x 5 inch I-N Spectroscopic glass plates. The
result of the combined scanners and camera systems was a set of
18 wavelength bands of imagery, representing wavelengths from
0.32µm in the ultraviolet to 14µm in the thermal infrared, plus
color and color infrared photos (Table 1).
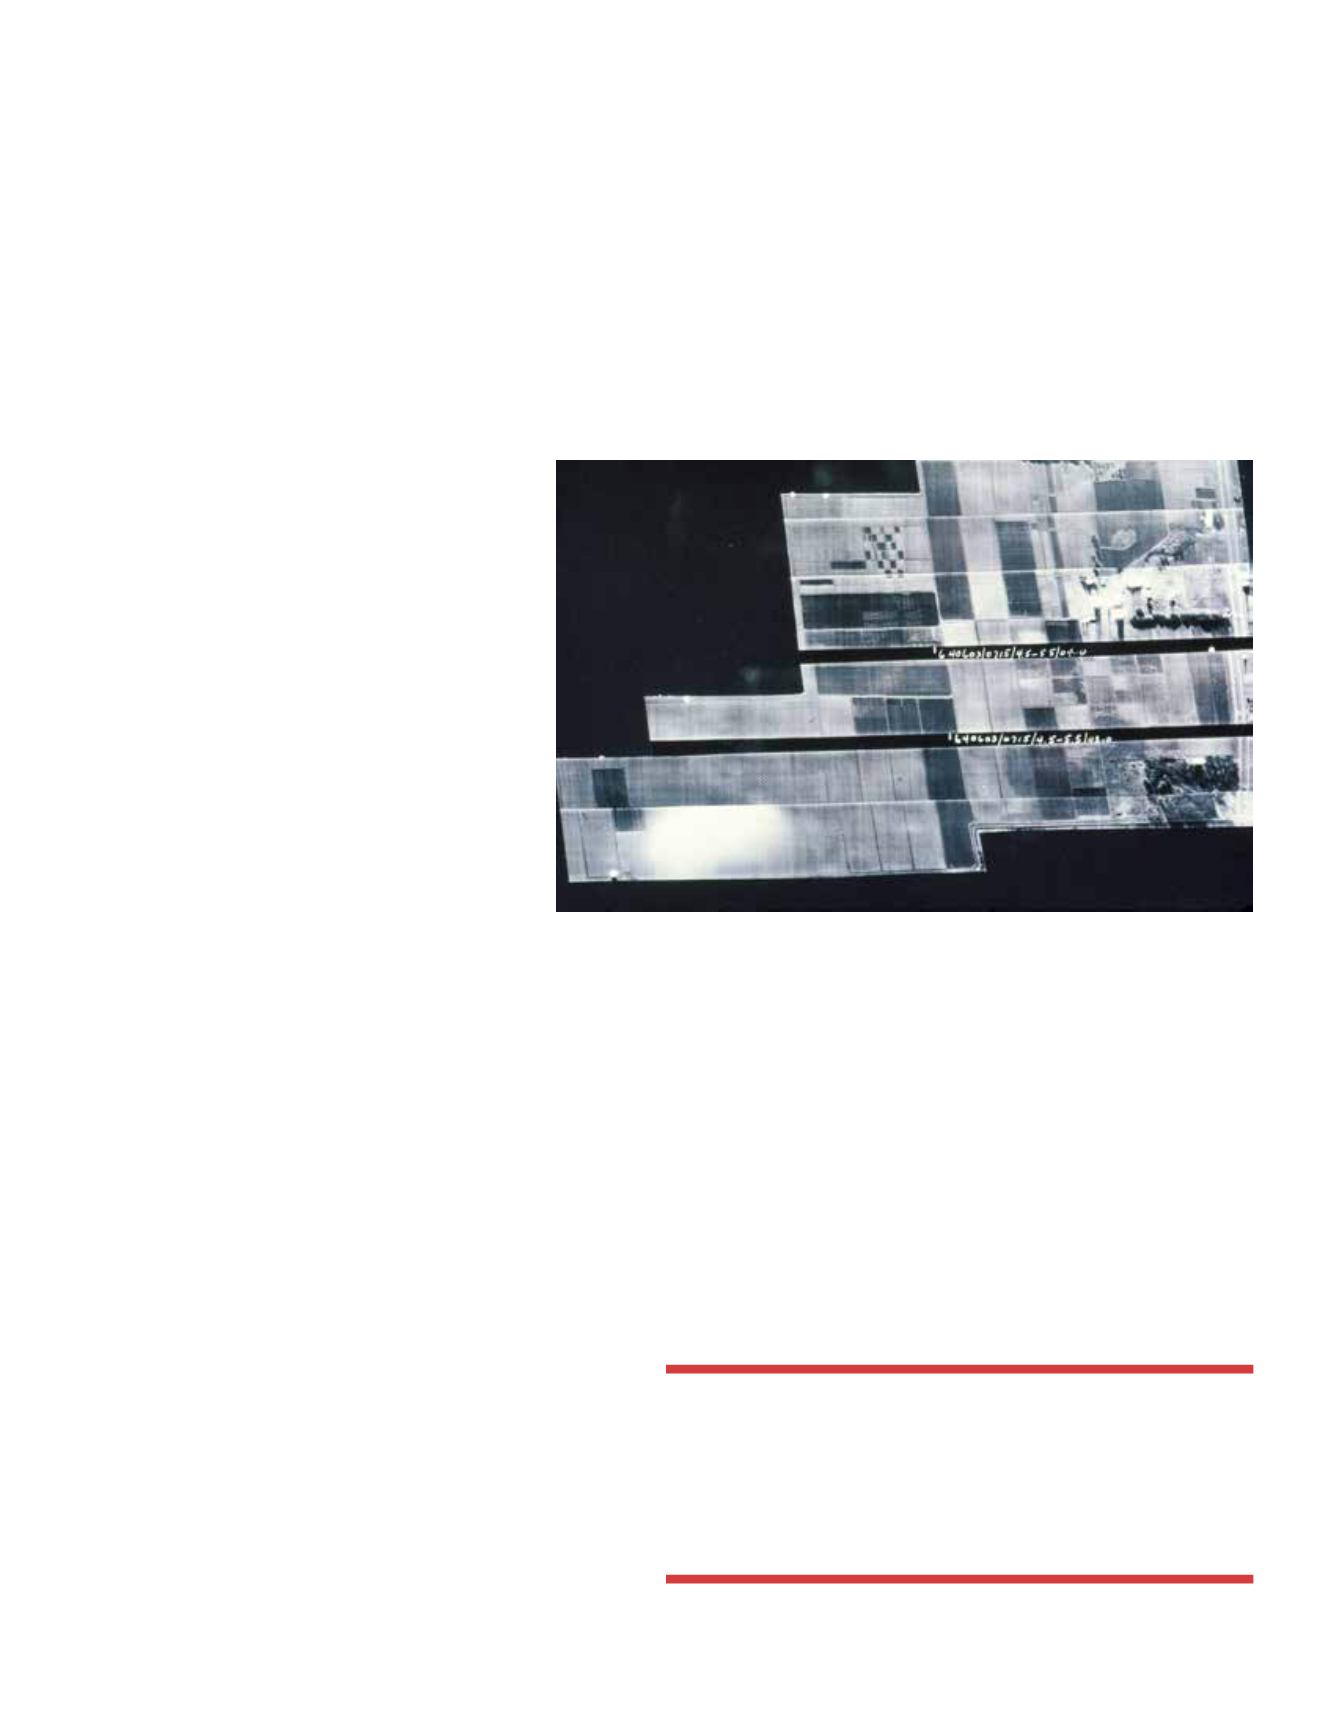
Figure 1. Example of “Classified” (later de-classified) strips of multispectral scanner data
(4.5 – 5.5 µm thermal infrared wavelength band).
“...because
the
scanner
imagery
was
classified as ‘confidential’, I had to keep it
in a locked cabinet, and no one else could
be in the room when I was working with the
imagery!”
Fifty years ago, in 1964, for the first
time ever, a multispectral scanner was
flown over a non-military target—the
Purdue (University) Agronomy Farm.


