PHOTOGRAMMETRIC ENGINEERING & REMOTE SENSING
September 2014
821
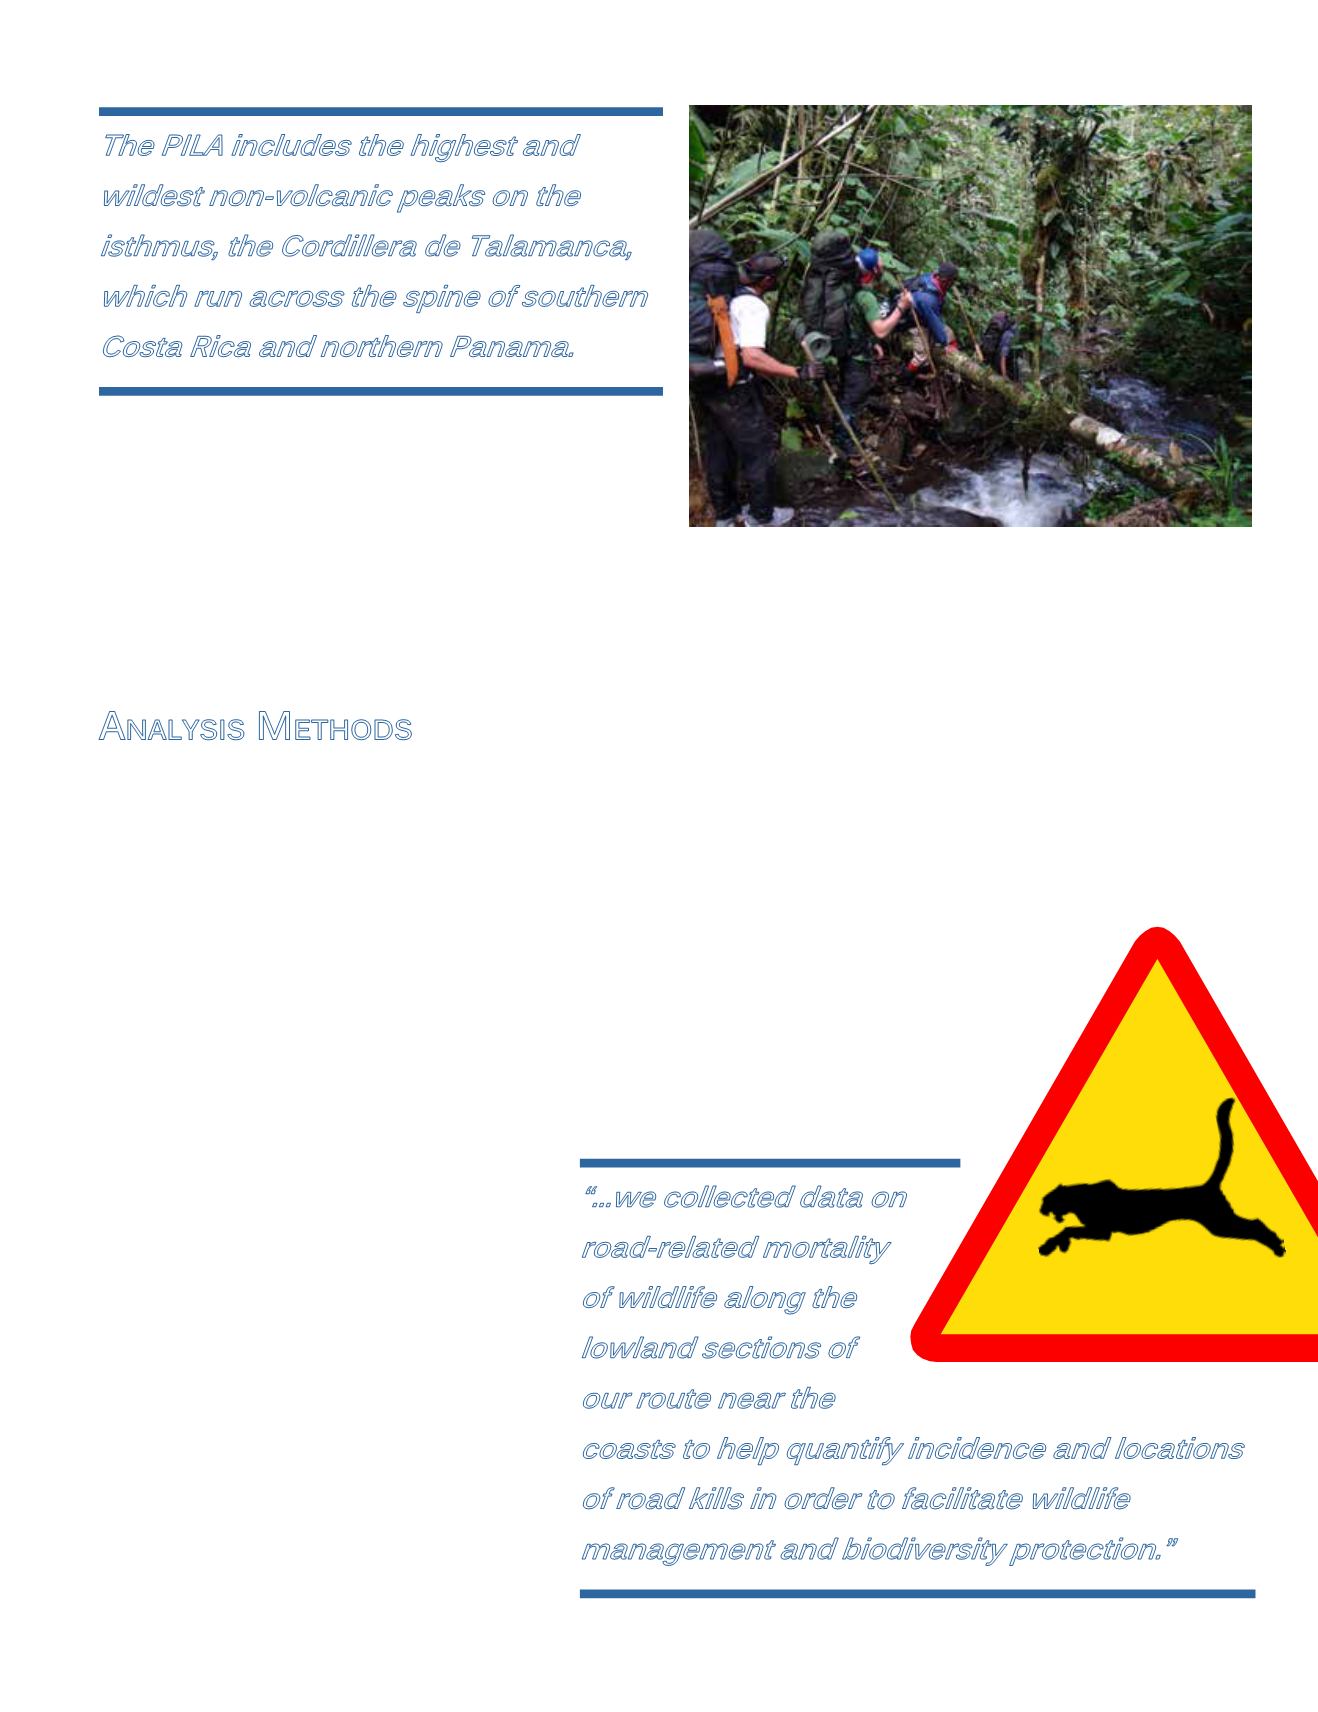
Figure 6: The research team walking through a creek to escape the
thick vegetation for a time.
The PILA includes the highest and
wildest non-volcanic peaks on the
isthmus, the Cordillera de Talamanca,
which run across the spine of southern
Costa Rica and northern Panama.
collected at set distances from previous locations. Additionally,
opportunistic pointswere takenwhenever distinct land features
were encountered (Figure 6). Specific parameters recorded at
each ground location included: UTM coordinates and altitude
from a handheld GPS, aspect and slope using the Suunto,
dominant and common species, canopy closures, vegetative
parameters, vegetation classes, soils, and an assessment of
any human impacts – grazing, trekking, campsite remnants,
trash, etc. Data was accessed for a 10-meter radius and photos
were taken in the eight standard directions and of the ground
and canopy for later reference.
“...we collected data on
road-related mortality
of wildlife along the
lowland sections of
our route near the
coasts to help quantify incidence and locations
of road kills in order to facilitate wildlife
management and biodiversity protection.”
landscape to examine how these factors affect presence and
absence, and acoustic behavior of bird and frog species. The
black carbon in water data will similarly be related to other
visible data on fire disturbances in the area upstream of
collection points and help inform the history of fire in the
region. Finally, the road kill data will be included in a database
by PILA staff with the objective of using RS tools to identify
key hazard areas for wildlife on roadways near the park.
A
nalysis
M
ethods
Our remote sensing analysis of the Cordillera de Talamanca
takes advantage of the historical period of record for Landsat
and so we utilize both Multispectral Scanner (MSS) and
Thematic Mapper (TM) for examining land cover trajectories
from the early 1970’s to today. Fortunately Landsat 8 allows
continuity in these measurements (Figure 5). Landsat
imagery is classified using the ground reference data
collected. Additionally, various vegetation indices such as
EVI (Enhanced Vegetation Index) and NDVI (Normalized
Difference Vegetation Index ) are used in our spatial statistical
analyses along with derived products such as NPP.
Topographic data is another critical component in our
research and elevation values are used to derive slope and
aspect information. We use elevation data from Global
Digital Elevation Models (GDEMs) created from
Advanced Spaceborne Thermal Emission and
Reflection Radiometer (ASTER) images – a passive
sensor on the Terra satellite where stereoscopic
correlation techniques were used to create a DEM
– and the Shuttle Radar Topography Mission
(SRTM) – a year 2000 space shuttle mission that
utilized radar to create a near global DEM. We
have forthcoming research that indicates the
best application for each DEM and so we utilize
the strengths of whichever is more useful for a
given application (Figure 5). This data is ground
verified by using a Suunto engineering compass
and inclinometer.
Ground reference data was collected using a
random stratified collection system - beginning
at a random point each morning, data was


