398
May 2014
PHOTOGRAMMETRIC ENGINEERING & REMOTE SENSING
STEP 3:
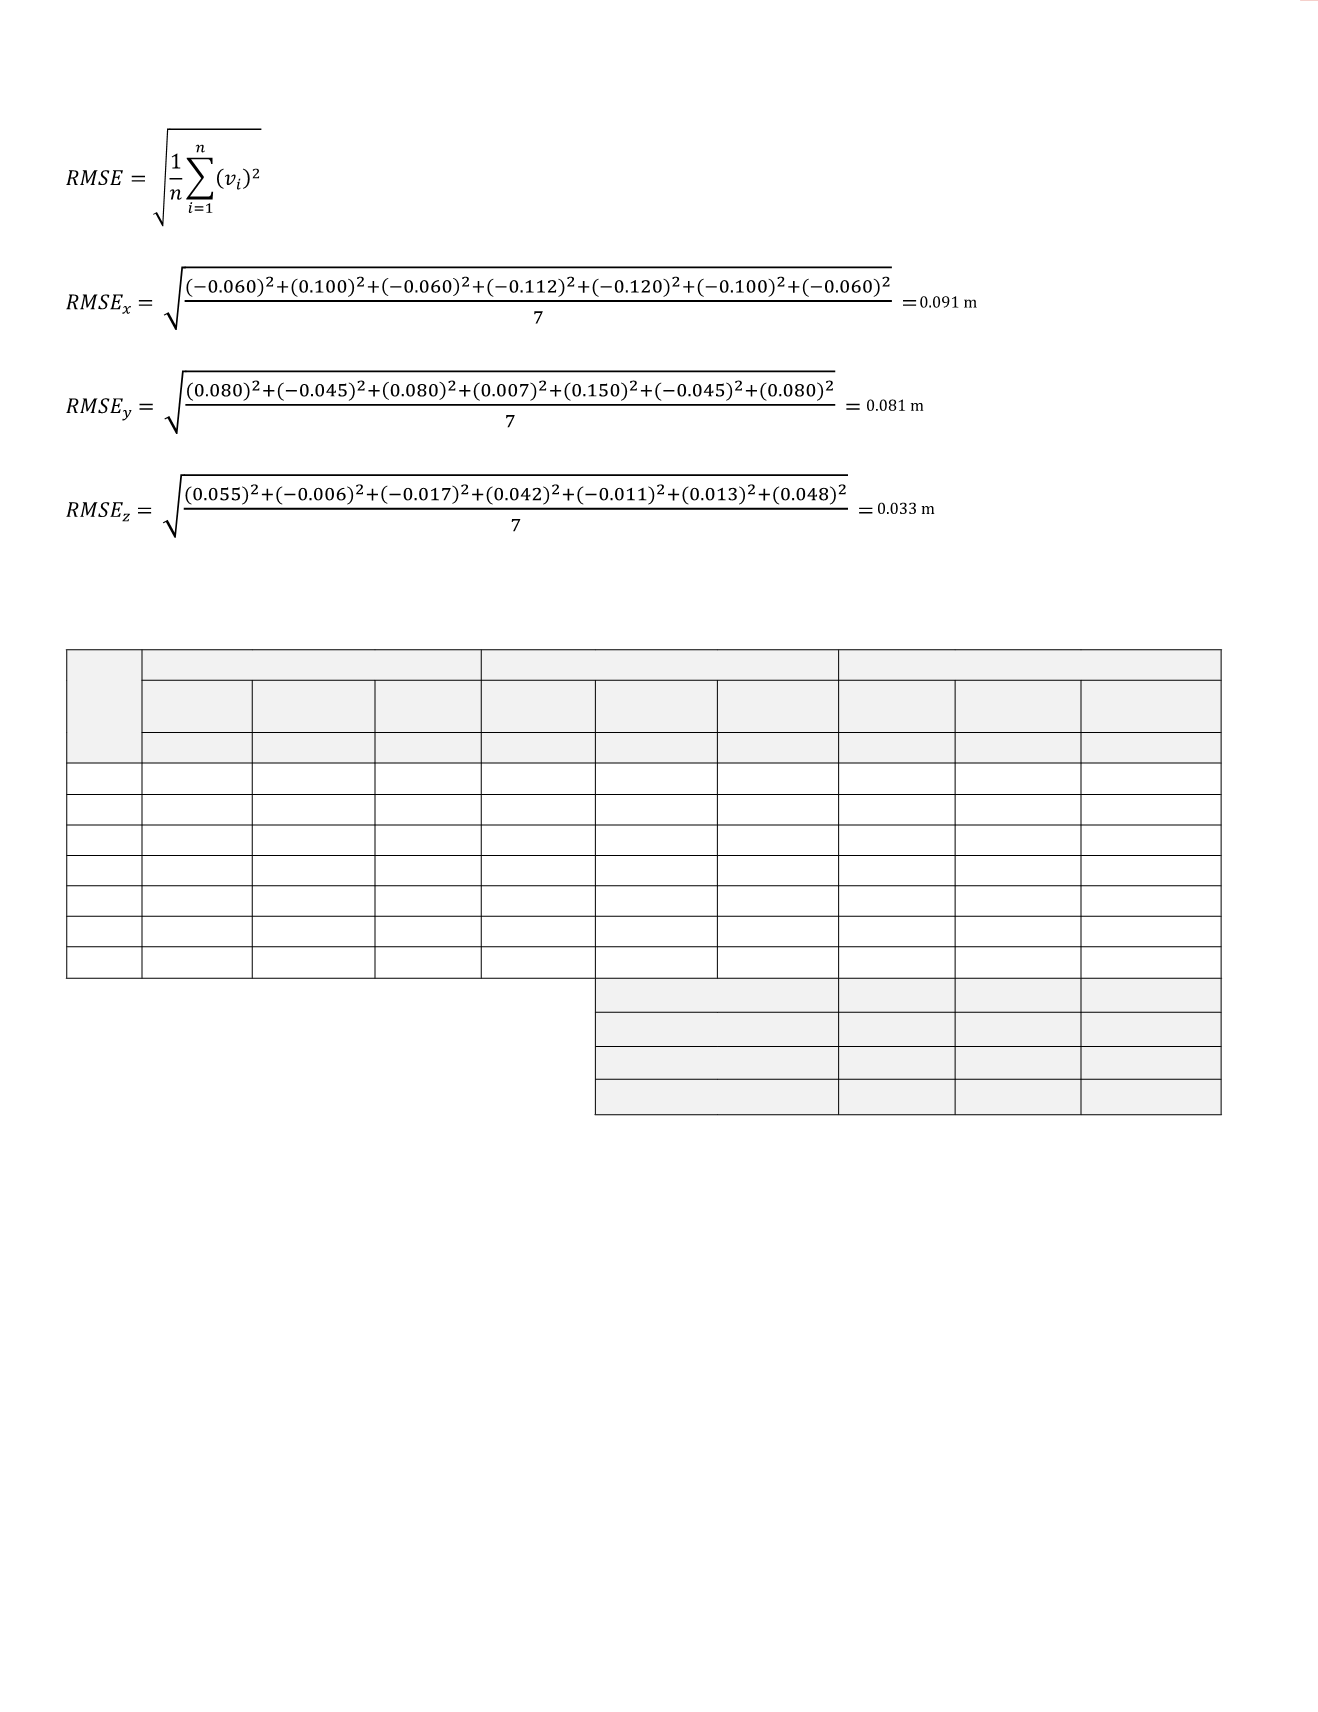
Compute Root Mean Squares Error (RMSE)
RMSE in Easting
RMSE in Northing
RMSE in Elevation
Table 4 contains tabulated values for all the previous computations.
Table 4 Computations of accuracy terms
Point
ID
Measured Values
Surveyed Values
Residuals
Easting
(E)
Northing
(N)
Elevation
(H)
Easting
(E)
Northing
(N)
Elevation
(H)
ΔE
(Easting)
ΔN
(Northing)
ΔH
(Elevation)
meter
meter
meter
meter
meter
meter
meter
meter
meter
CHK1
435497.773 5180055.008 345.719 435497.833 5180054.928 345.664
-0.060
0.080
0.055
CHK2
435725.656 5165270.316 468.886 435725.556 5165270.361 468.892
0.100
-0.045
-0.006
CHK3
435979.436 5175221.390 443.009 435979.496 5175221.310 443.026
-0.060
0.080
-0.017
CHK4
439669.309 5188155.815 190.855 439669.421 5188155.808 190.813
-0.112
0.007
0.042
CHK5
448111.544 5184558.142 190.447 448111.664 5184557.992 190.458
-0.120
0.150
-0.011
CHK6
450709.272 5164362.790 433.864 450709.372 5164362.835 433.851
-0.100
-0.045
0.013
CHK7
452302.471 5175490.022 226.278 452302.531 5175489.942 226.230
-0.060
0.080
0.048
Number of check points
7
7
7
Mean (m)
-0.059
0.044
0.018
StDEV (m)
0.075
0.073
0.030
RMSE (m)
0.091
0.081
0.033
After computing the RMSE in Easting, Northing, and
Elevation we need to evaluate the acceptance or rejection
criteria according to Class I of the ASPRS map accuracy
standard. Before we do that, we will need to examine the
presence of biases in the computed statistics. The best way
to evaluate biases is to examine the Mean values. Mean
value that exceed 25% to 50% of the RMSE value may
indicate the presence of a bias in the measurements on
condition that the standard deviation (the fluctuation in the
measurements) is low. If for example, we look at the mean
value for the Easting we find it to be equal to -0.059m while
the standard deviation is 0.075m. A situation like this tells
us that the high value of the mean is accompanied by a high
value for the standard deviation and therefore an expected
low value of the bias. Most of the value of the mean can be
interpreted as a bias if the standard deviation is very low or
approaches zero. In our case, removing the value of the mean
(-0.059m) from each of the Easting measurement may not
provide enough improvement in the value of the RMSE and
therefore it may not be worth such an exercise. The RMSE
of Easting of 0.091m may become 0.069m with improvement
of 2.2 cm when we subtract the value of the mean from the
measurements. A decision needs to be taken by the person
in command on whether such small improvement is worth
adjusting the easting of all the deliverable tiles. In any case,
we will pursue such an exercise and subtract the value of
the Mean from the measured values for Easting, Northing,
and Elevation. Table 5 illustrates the slight improvement
in the Easting and Northing after we attempted to remove
the biases. The RMSE of Easting improved by 2.2 cm from
0.091m to 0.069m while the RMSE of Northing improved by
1.3 cm from 0.081m to 0.068m and no improvement is noted
in the RMSE for the elevation.
continued on page 400


