PHOTOGRAMMETRIC ENGINEERING & REMOTE SENSING
November 2014
1011
V
egetation
D
ynamics
in
a
T
ransboundary
S
emi
-
arid
S
avanna
W
atershed
The satellite-derived analyses of flooding and
fire dynamics in a semi-arid savanna of southern
Africa are continuing with additional fieldwork
performed during the summer of 2014 and new
research directions being developed in collaboration
with other programs and institutions. After
decades of research and improved change-detection
capabilities, monitoring vegetation dynamics using
long-term, repetitive satellite-derived data remains
extremely important. Correct and consistent
measurement of vegetation dynamics is especially
important in marginal landscapes such as semi-
arid savannas. Quantifying changes in vegetation
cover is important not only to asses states and
trends, but particularly to improve the prediction
capabilities of climate models and enable them to
better capture vegetation variations induced by
large-scale climate teleconnections such as El Niño
Southern Oscillation (Kandji et al., 2006). The
warming trend across southern Africa over the last
several decades is consistent with the global rise
in temperatures starting with the 1970s (NCAR,
2005). Additionally, the last decade has experienced
a decrease in net primary productivity (NPP)
associated with large-scale droughts primarily
in the southern Hemisphere and specifically in
the southern African region (Zhao and Running,
2010). Such changes in climate patterns have the
potential to impact savanna ecosystem functioning
in a variety of ways. For example, increased temperatures
and wind speeds combined with decreasing precipitation
and relative humidity might create warmer, drier conditions
that are more conducive to higher return intervals for fire
(Hoffmann et al., 2002). Humans also strongly impact
changes in savanna landscapes through land-use decisions
that modify fire dynamics, stocking rates for livestock, and
agriculture production. Here we briefly present initial results
that decompose the general trend in vegetation pattern for
the Chobe River Basin and how the trend is linked to regional
inundation pulses and inter-annual fire regimes.
We used time-series of AVHRR and MODIS NDVI
that were geo-rectified and re-projected to the Universal
Transverse Mercator (UTM), WGS84 coordinate system
using nearest neighbor resampling. We created spatially-
averaged monthly maximum value composites (MVC) from
both the AVHRR and MODIS NDVI data. The MVC values
were calculated for the growing season (March-September)
for each year in the analysis (1985-2010). Due to the strong
correlation of precipitation and NDVI and because we used
a multi-sensor dataset (both AVHRR and MODIS), we
standardized NDVI values for each year by subtracting the
overall
meanNDVI
from growing season NDVI and dividing
through by the overall
s.d.NDVI
(standard deviation). These
growing season NDVI standard normal deviates were used
to remove the seasonal signal and to record NDVI variations
across an area with respect to the mean. Standardized NDVI
values track changes in the degree of wetness or dryness of
ground vegetation, so that negative values indicate below
normal vegetation conditions indicative of drought and vice
versa. In addition, we smoothed the standardized monthly
MVC NDVI values with different-interval running averages
to isolate partially the inter-annual variability in CRB: a
three and a seven-year moving average (based on work by
Nicholson (2001) who identified two to seven-year wet and dry
cycles in southern Africa associated with ENSO). Even though
the period considered in our analysis (25 years) is not long
enough to reflect long-term trends (which happen on roughly
a 20-30-year time span, Nicholson et al., 2001), it does provide
some interesting insights into the trend and directionality of
change in vegetation dynamics.
Wemapped spatial patterns of growing seasonstandardized
NDVI values for CRB for each of these years (Figure 7). Higher
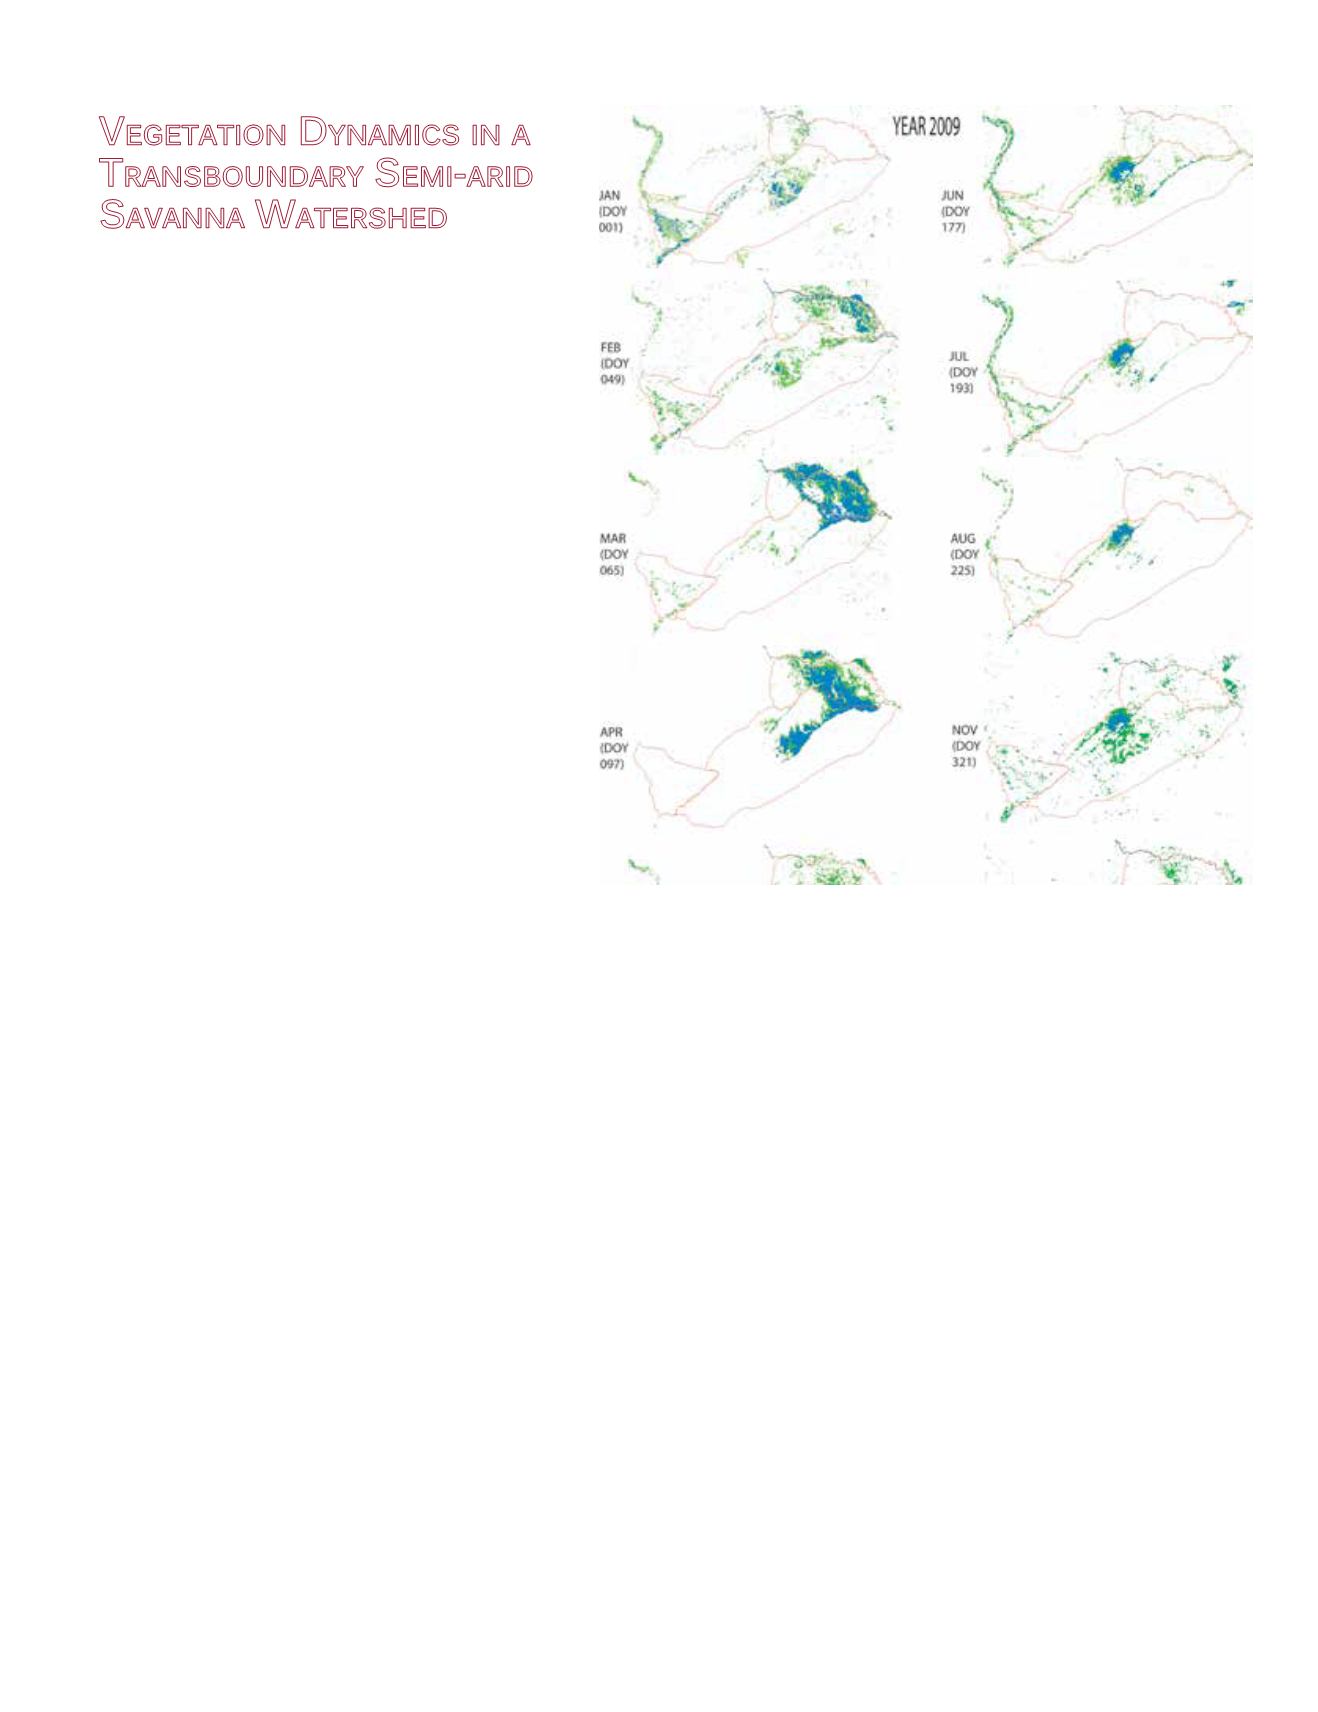
Figure 6. The spatial distribution of inundation in the Chobe-Zambezi-Mamili
system during 2009, with September and October missing due to low spatial
extent of flooding. Areas of blue indicate the distribution of flooded pixels, while
areas of green indicate mixed pixels
(Source: Pricope 2013).


