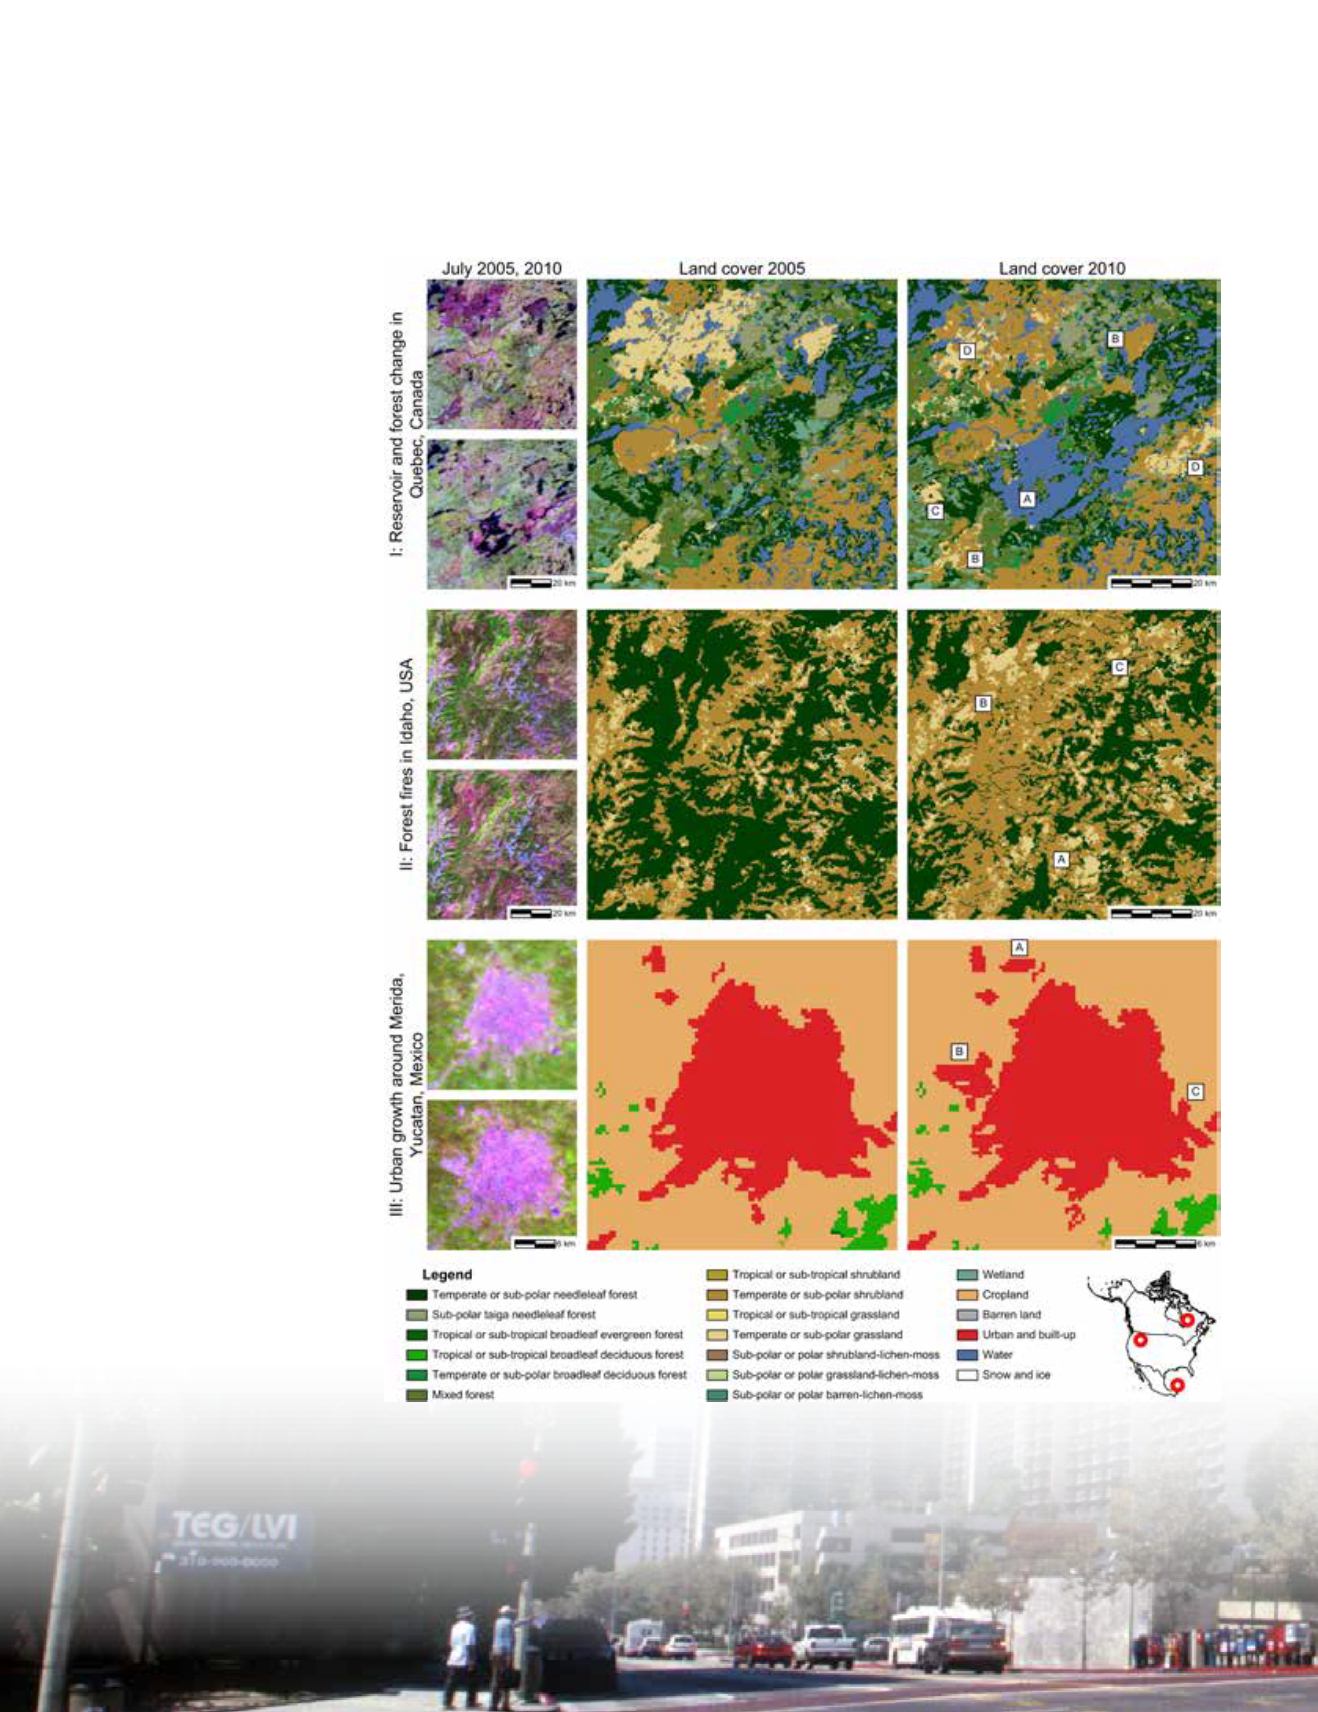
Figure 2. Case studies for change detection. I: Permanent flooding and large fires in northern Quebec. II: Forest to
shrubland change due to large fires in Idaho in 2007. III: Urban growth around Merida, Mexico. Images from July
2005 and 2010 show MODIS bands in combination R: 1628-1652nm, G: 841-876nm, B: 620-670nm.
class Sub-polar taiga needleleaf forest also shows a negative
balance (-1.77%), likely due to the same change agents, with a
loss to Temperate or sub-polar grassland. Other classes with a
negative change balance include Wetland (-2.43%) and Crop-
land (-1.32%), both with no single
class contributing to change. The
low gain and loss of Cropland rel-
ative to its significant area extent
(13.83%) indicates a high spatial
stability of agricultural land use
patterns.
In spite of its much smaller area
(7.67%) Temperate or sub-polar
grassland shows the highest pos-
itive balance (15.12%) with most
changes in the Canadian boreal
belt and the northern Cordilleras.
Its net loss to Temporal or sub-po-
lar shrubland was outweighed
by gains from other forest class-
es, in particular Temperate or
sub-polar needleleaf forest. Oth-
er classes with positive balances
are Temperate or sub-polar shru-
bland (9.44%) and Temperate or
sub-polar broadleaf deciduous
forest (9.20%). The latter class is
mainly located in the greater Ap-
palachians, Ozarks, and southern
Great Lakes region and gained
from Mixed forest and Temper-
ate or sub-polar shrubland, which
could indicate successional stages
of forest growth and maturation.
Mixed forest in the southern
Canadian boreal, northern New
England, and mountainous Mex-
ico are of an interesting case, be-
cause it suggests changes in forest
patterns and compositions with a
near-zero balance (-0.39%). Trop-
ical or subtropical forests, shrub-
lands and grasslands in Mexico as
well as lichen-moss compositions
in the Canadian and Alaska tun-
dra do not show prominent spatial
nor statistical patterns. From the
remaining classes, Water shows a noteworthy positive balance
(1.09%) with gains from forest classes and Cropland, indicat-
ing the construction or filling of artificial lakes for hydroelectric
power and inundations in 2010.
922
October 2014
PHOTOGRAMMETRIC ENGINEERING & REMOTE SENSING


