“compactness” parameter, which determine the degree of
roundness and compactness the objects shape are forced into
(ranging from 0 to 1), thus influences the geometry of objects.
We manually selected a shape and compactness parameter
value of 0.3 and 0.5, respectively, for all segmentations to
prevent the generation of very irregularly shaped objects, but
allowing objects to form primarily on the basis of the underly-
ing raster data sets.
The frequency distribution matrices of the training samples
were compared with the frequency distribution matrices of
the overlapping image objects at five different point locations
within each training sample. Based on the sum of absolute
error between both matrices, a segmentation score is calcu-
lated. The average score out of five comparisons per training
sample was used to evaluate segmentation accuracy of each set
of objects and to determine an optimal scale parameter value
(step 5 in Figure 2). Many segmentation evaluation methods
exist with each their strengths and weaknesses to evaluate
different kinds of segmentations of different kinds of data sets,
and for different purposes (Zhang, 1996). The method used
in this study can be justified by our goal to capture the same
topographic signatures of cirque components by the segmented
objects in the different areas, which are the basis of subsequent
object classification. For details on the parameter optimization
used in this study Anders
et al
. (2011) are referred.
Because each cirque component has different segmenta-
tion parameters, all components need to be extracted sepa-
rately. First objects are calculated in the entire area using the
optimized segmentation parameters of the first component
(step 6 in Figure 2) to create high-quality objects for one
specific component. Subsequently, classification criteria were
formulated based on expert knowledge (step 7 in Figure 2),
and topographic signatures derived from the training samples
served as inspiration and for determining threshold values of
the classification criteria. Examples of classification criteria
are “low
NIR
values” for cirque lake objects, “high relative
elevation values” for cirque divide objects, and “high Slope
Angle values” for cirque headwall objects. Manual heuristics
are used to determine and fine-tune the threshold values of
the classification criteria (steps 8 and 9 in Figure 2). After the
classification rules are applied to the image objects, the cirque
components are extracted (step 10 in Figure 2).
The remaining unclassified area is re-segmented with
feature-specific segmentation criteria of the subsequent cirque
component, and the procedure starts over from step 6 on-
wards, until all components are extracted (step 11 in Figure
2). As a consequence, the cirque components are extracted
in a stratified fashion, where distinct and easy to identify
components are extracted first (cirque lake and divide), and
features with potential gradual or fuzzy boundaries last
(cirque headwall and floor). Left-over objects are merged with
neighboring classified objects when 100 percent enclosed by
a single component, or labeled as “unclassified” so they are
considered as not being part of the cirque complex. Classified
objects were exported as Esri shapefiles for further analysis
and visualization.
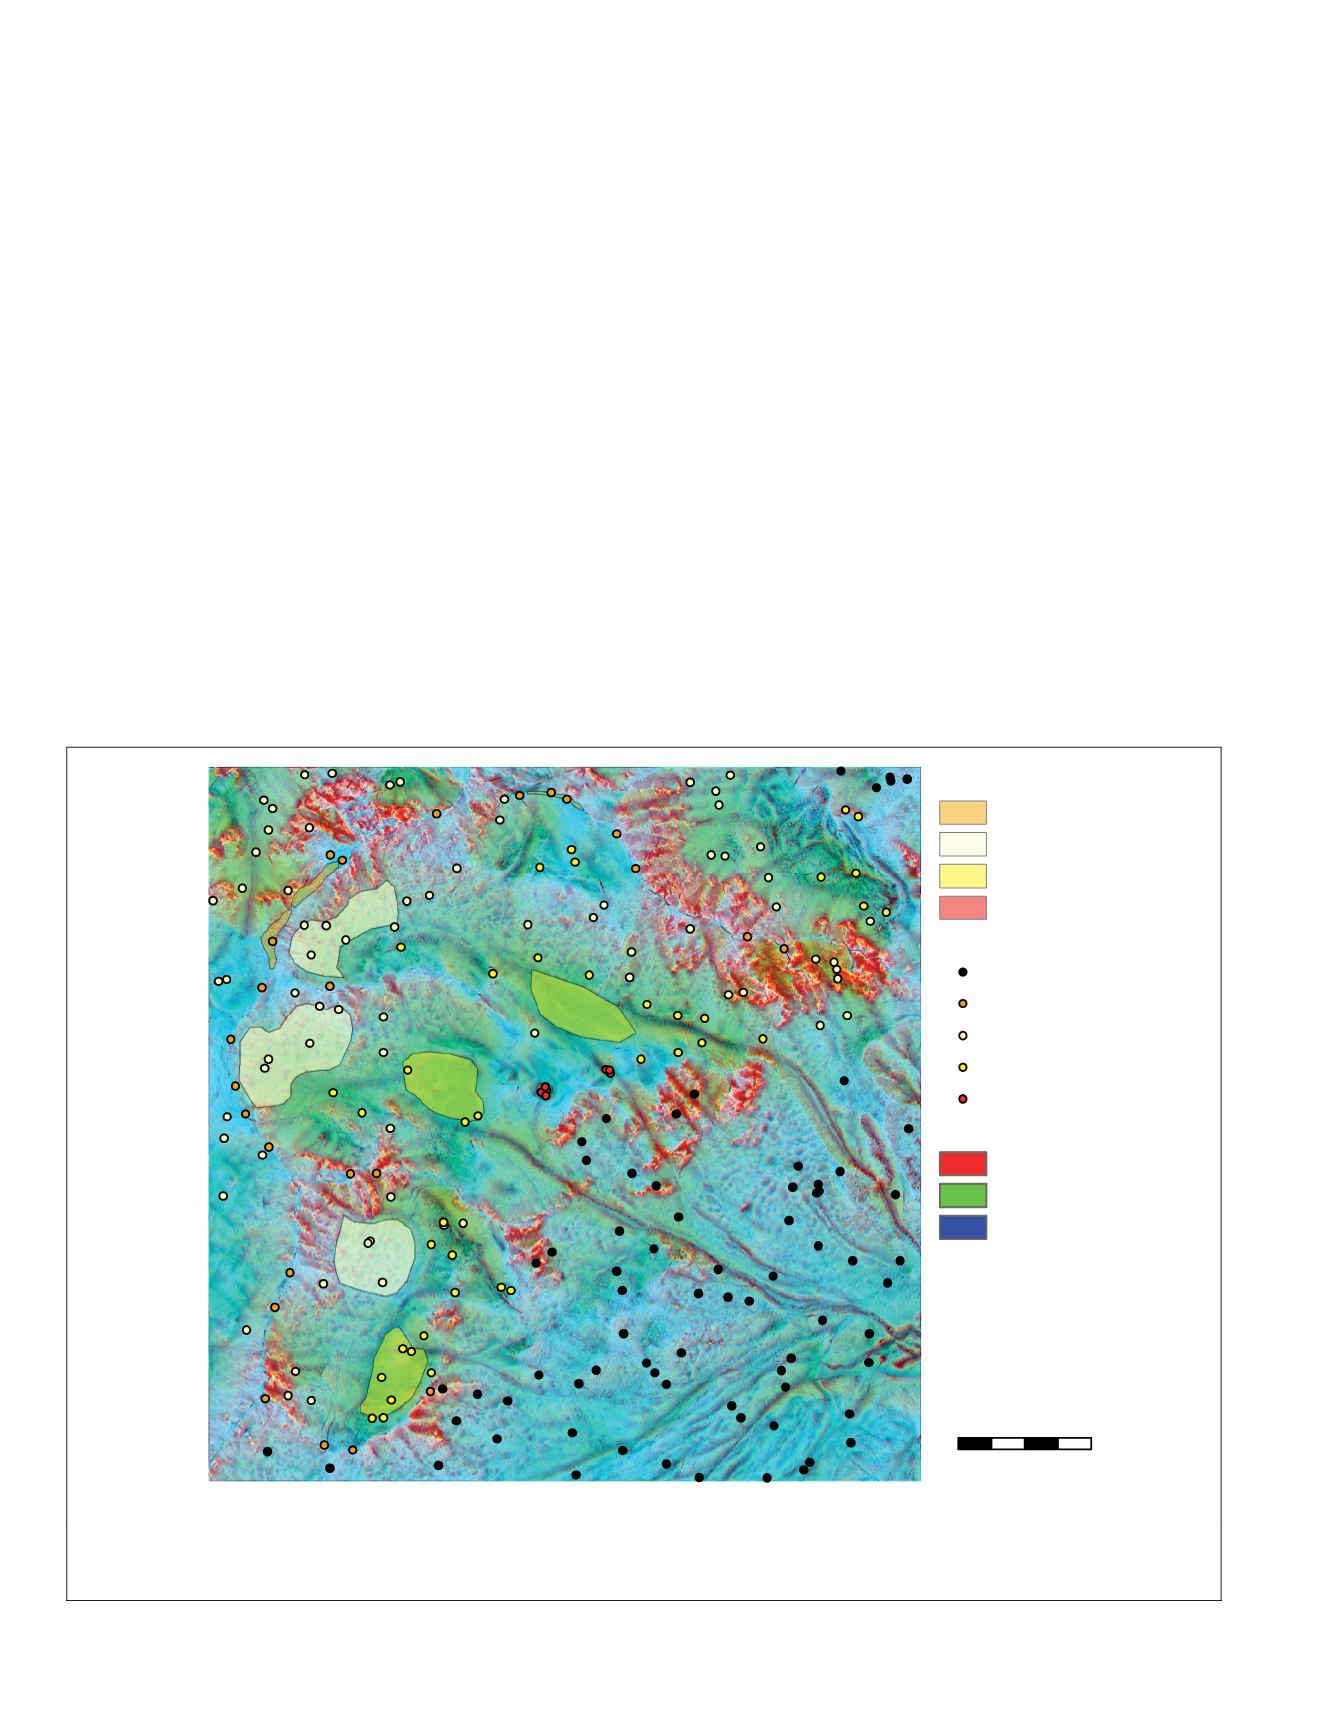
Training samples
Divide
Headwall
Floor
Cirque lake
Validation points
No compoment
Divide
Headwall
Floor
Lake
LSP composite
Slope angle
TO25
TO251
0
200
m
Plate 2. Training samples and validation points were manually digitized and labeled after interpretation of the CIR image and an LSP
composite layer (with Slope Angle and Topographic Openness parameters (25 × 25 and 251 × 251 m search radius). The latter is shown
in the background.
510
June 2015
PHOTOGRAMMETRIC ENGINEERING & REMOTE SENSING


