PHOTOGRAMMETRIC ENGINEERING & REMOTE SENSING
May 2015
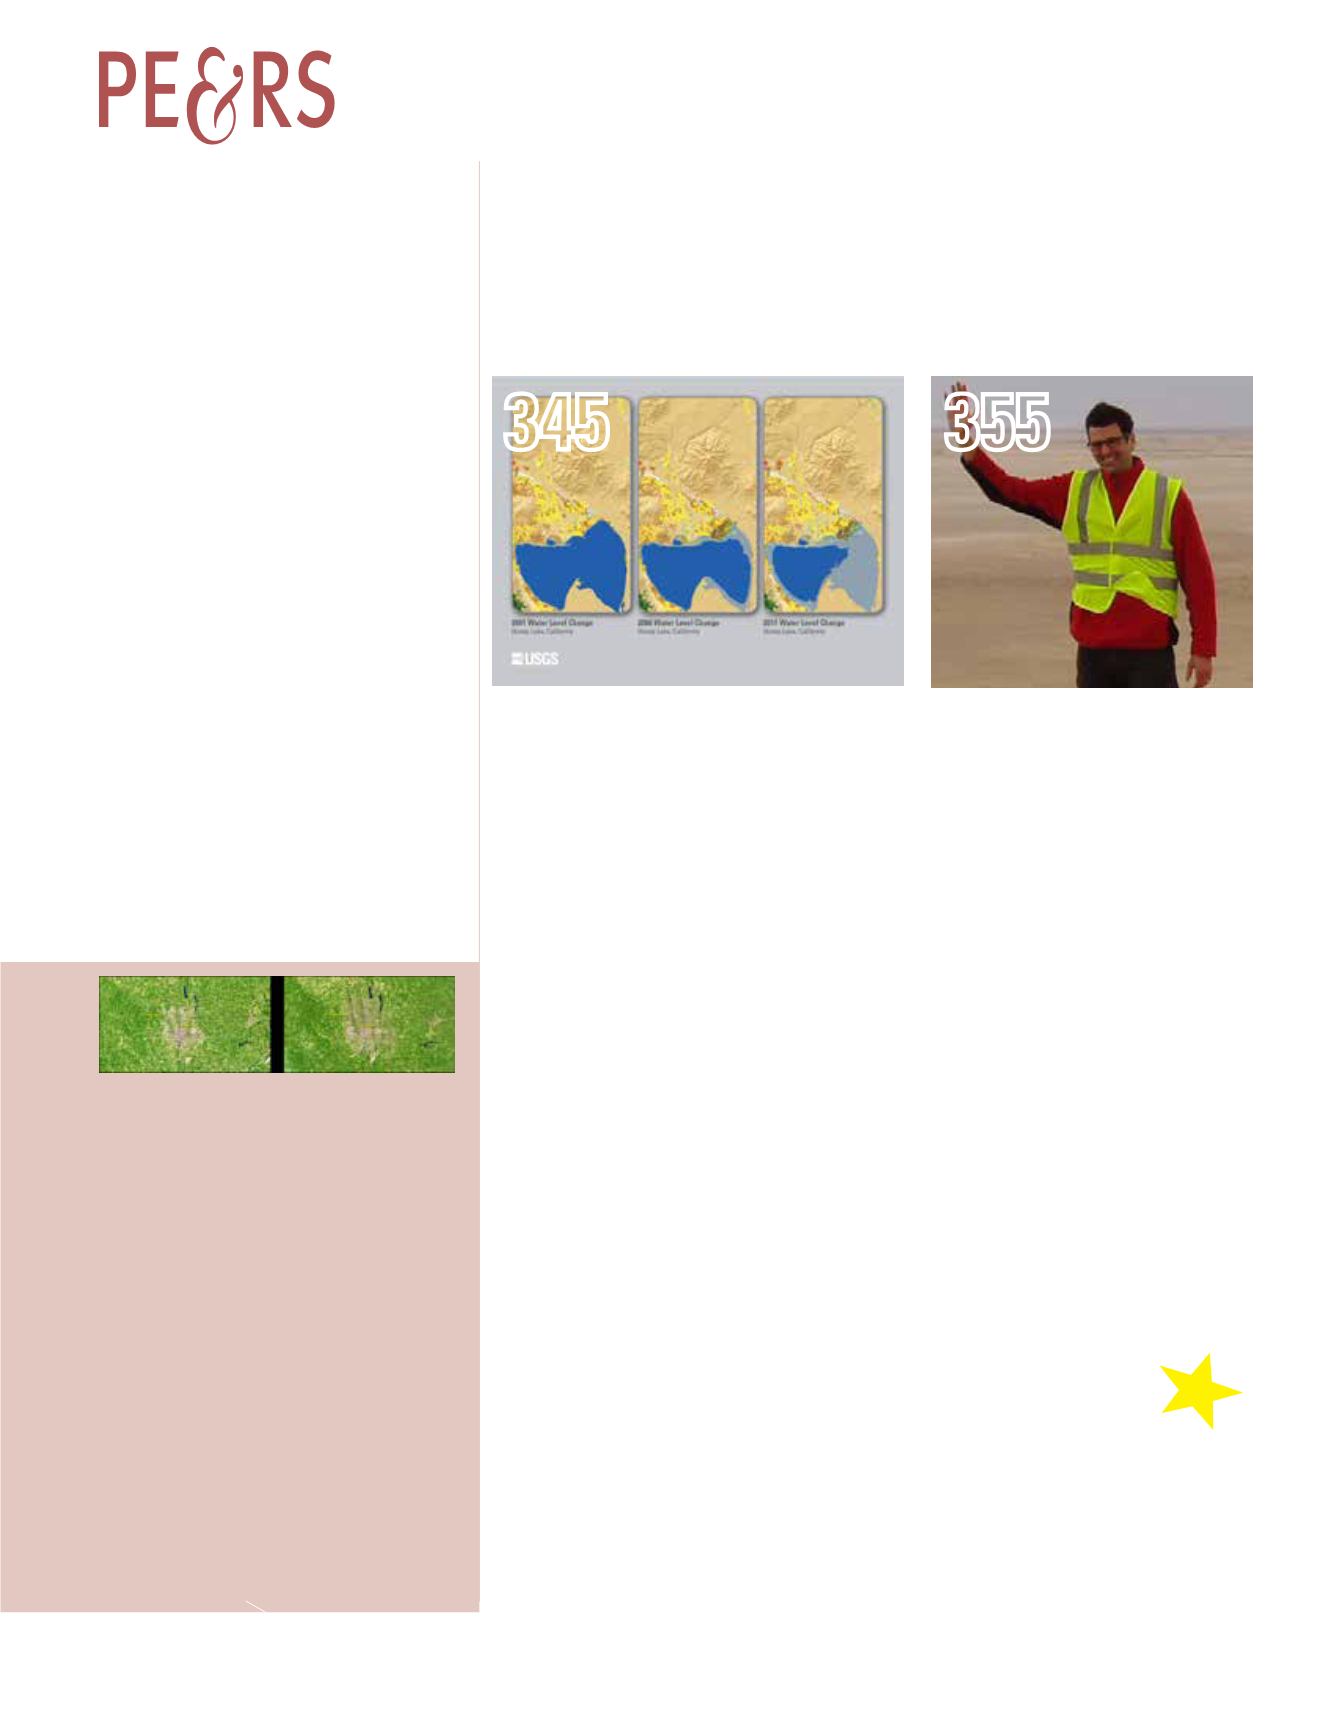
343
H I GHL I GHT ART I C L E
Collin Homer, Jon Dewitz, Limin Yang, Suming Jin, Patrick Danielson, George
Xian, John Coulston, Nathaniel Herold, James Wickham,
and
Kevin Megown
PE ER - REV I EWED ART I C L ES
Tammy E. Parece
and
James B. Campbell
Identifying often-neglected urban watershed steps to delineate the true area and
boundary of a highly urbanized watershed.
Jinghui Yang
and
Jixian Zhang
A straightforward and high-parallelized method is applied to investigate parallel
performance of five categories of typical algorithms in remote sensing based mapping on
two multi-core computers.
Cody P. Gillin, Scott W. Bailey, Kevin J. McGuire,
and
Stephen P. Prisley
Varying grid resolution of Lidar-derived DEMs showed that watershed boundaries and
upslope accumulation areas were most dependent on DEM processing; their utility in
watershed analyses may be compromised if the best DEM resolution is not chosen for a
given study site.
Min Wang, Yanxia Sun,
and
Guanyi Chen
A novel neighborhood model for use in high spatial resolution remote sensing image
segmentation.
Chris W. Strother, Marguerite Madden, Thomas R. Jordan,
and
Andrea Presotto
An automated data mining approach for detecting the tallest trees within the large
LiDAR data set of the Great Smoky Mountains National Park.
PHOTOGRAMME TR I C ENG I NE ER I NG & REMOT E SENS I NG
The official journal for imaging and geospatial information science and technology
May 2015 Volume 81 Number 5
APPLICATIONS
PAPER
COLUMNS
Book Review—
Thermal Infrared Remote
359
Sensing: Sensors, Methods, Applications
ANNOUNCEMENTS
Pennsylvania Celebrates National
362
Surveyors’ Week
DEPARTMENTS
Ohio’s capital city, Columbus, is situated along the Scioto
River and is one of the fastest growing cities in the
state. In 1986, the municipal population was estimated
at 600,000. The latest population estimate for Columbus
from the U.S. Census Bureau is over 820,000.
These two images show Columbus and surrounding
areas in 1986 and again in 2014. The second image
shows the gray urban areas expanding into previous
agricultural land, which is indicated by green patchy
areas. The bright areas throughout the city are retail and
industrial centers. The dark blue spots along the river in
the southern part of the city are wastewater treatment
ponds and other ponds associated with local sand and
gravel quarries.
The historical record provided by Landsat images can be
a useful tool for city managers, planners, and scientists
who are monitoring and documenting the changes to
Earth’s land cover caused by urban expansion.
Sensor: L5 TM, L8 OLI
Path/Row: 19/32
Lat/Long: 40.300/-82.600
Category: World Cities
Download High Resolution
Date Posted: 12/16/2014
This Landsat 8 Image can be viewed at landsat.
usgs.gov/gallery_view.


