PHOTOGRAMMETRIC ENGINEERING & REMOTE SENSING
July 2016
457
The collection was carried out with a HRQLS system
equipped with a single-wedge optical scanner. At a nominal
AGL of 2,286 m (7,500 ft) where our data was acquired, the
maximum cone half-angle of 10 degrees provides a swath of
806 m. At a flight speed of 165 knots, the coverage rate is
246 km
2
/h. The point clouds are in las format. The Forest and
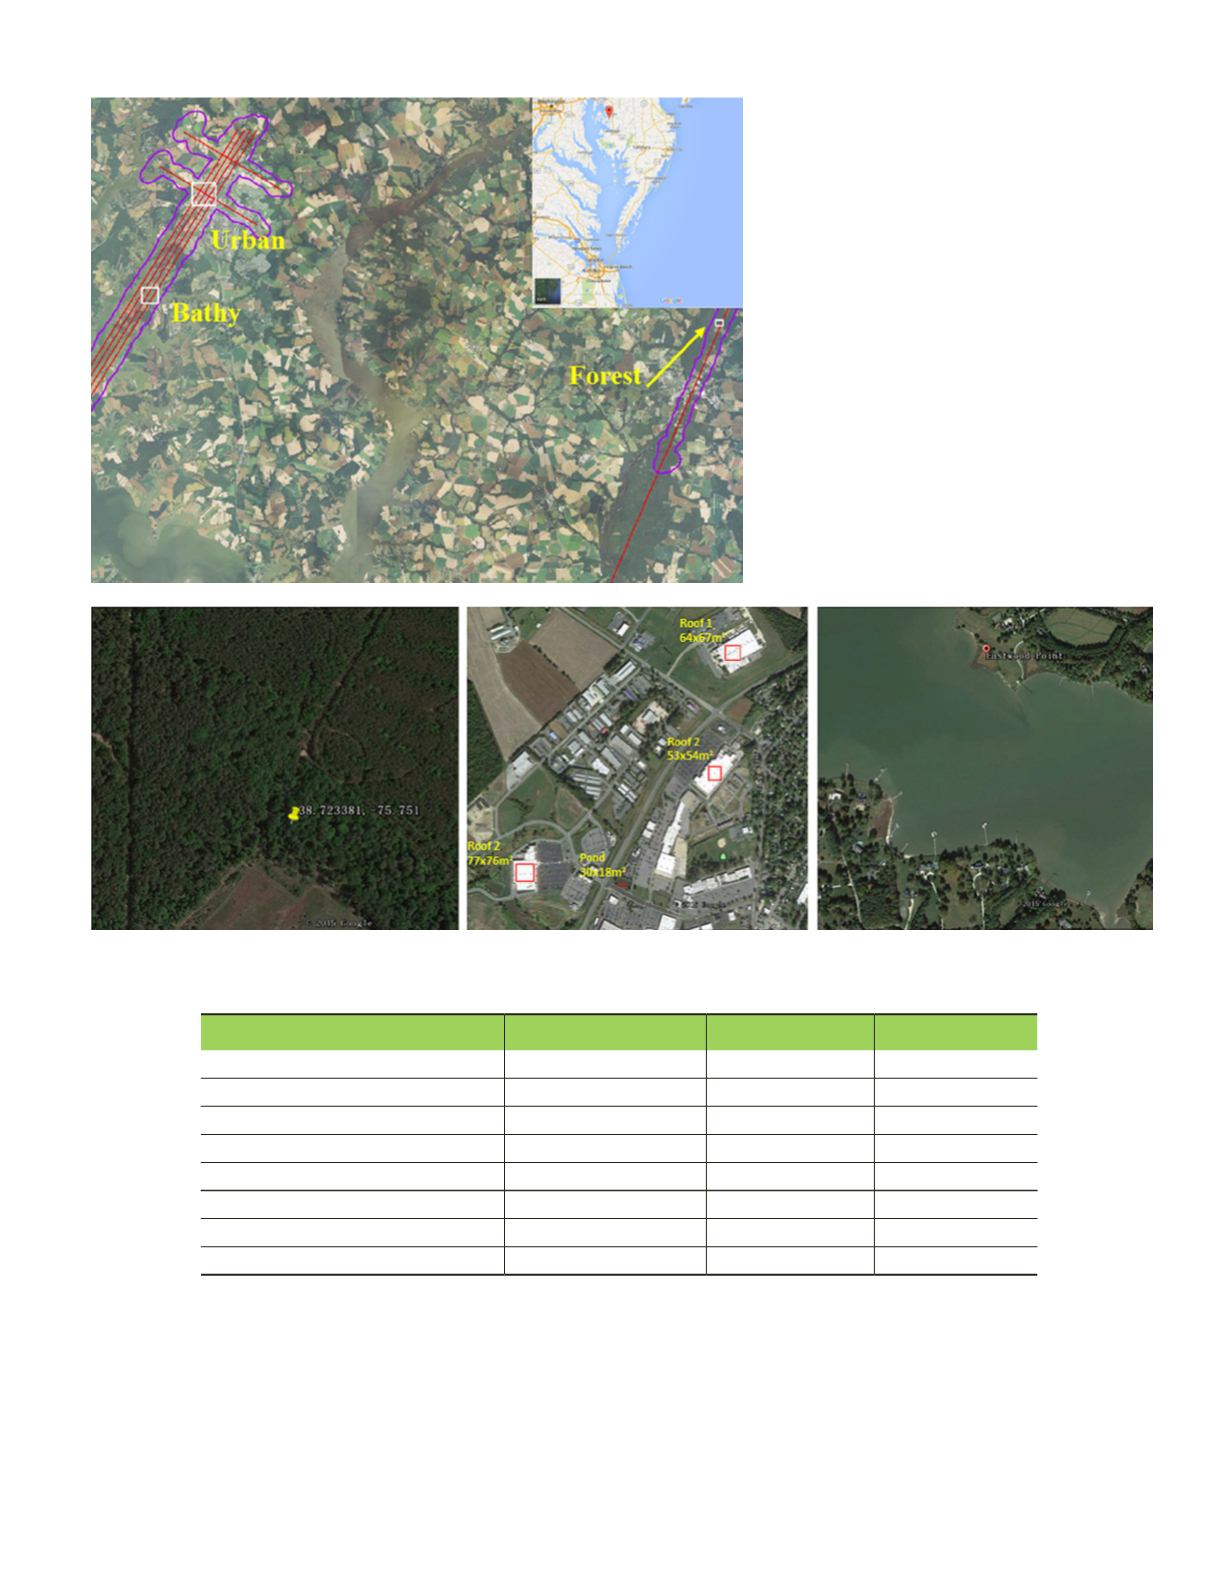
Figure 1. Flight area and the airplane trajectory.
An inset map at the upper-right corner shows the
location of the study area as an overview. Each red
line was flown in two directions. Both directions were
included in the Urban and Forest samples; only one
direction was included in the Bathy sample.
Figure 2. Images (Google Earth) of the three datasets (from left to right: Forest, Urban and Bathy).
Table 3. Summary of the test datasets collected by the HRQLS system.
Dataset
Forest
Urban
Bathy
Location
Idylwild Natural Area
St. Aubins Heights Eastwood Point
Size (width x height)
403 x 344
1,285 x 1,242
906 x 864
# Passes
2
2
1
# Points
1,403,103
20,385,028
2,954,549
Point density (# per sq. m)
10
18
4
# Ground points after filtering
494,357
12,309,811
789,451
Ground point density (# per sq. m)
3.6
10.1
1.1
Ground spacing (m)
0.52
0.31
0.95
Urban areas were covered by two passes, while the Bathy
area was mapped in one pass. Properties of the datasets are
summarized in Table 3.


