PHOTOGRAMMETRIC ENGINEERING & REMOTE SENSING
April 2017
257
CASE I: T
esting
M
ethodology
, N
umber
and
C
onfiguration
of
G
round
C
ontrol
N
etwork
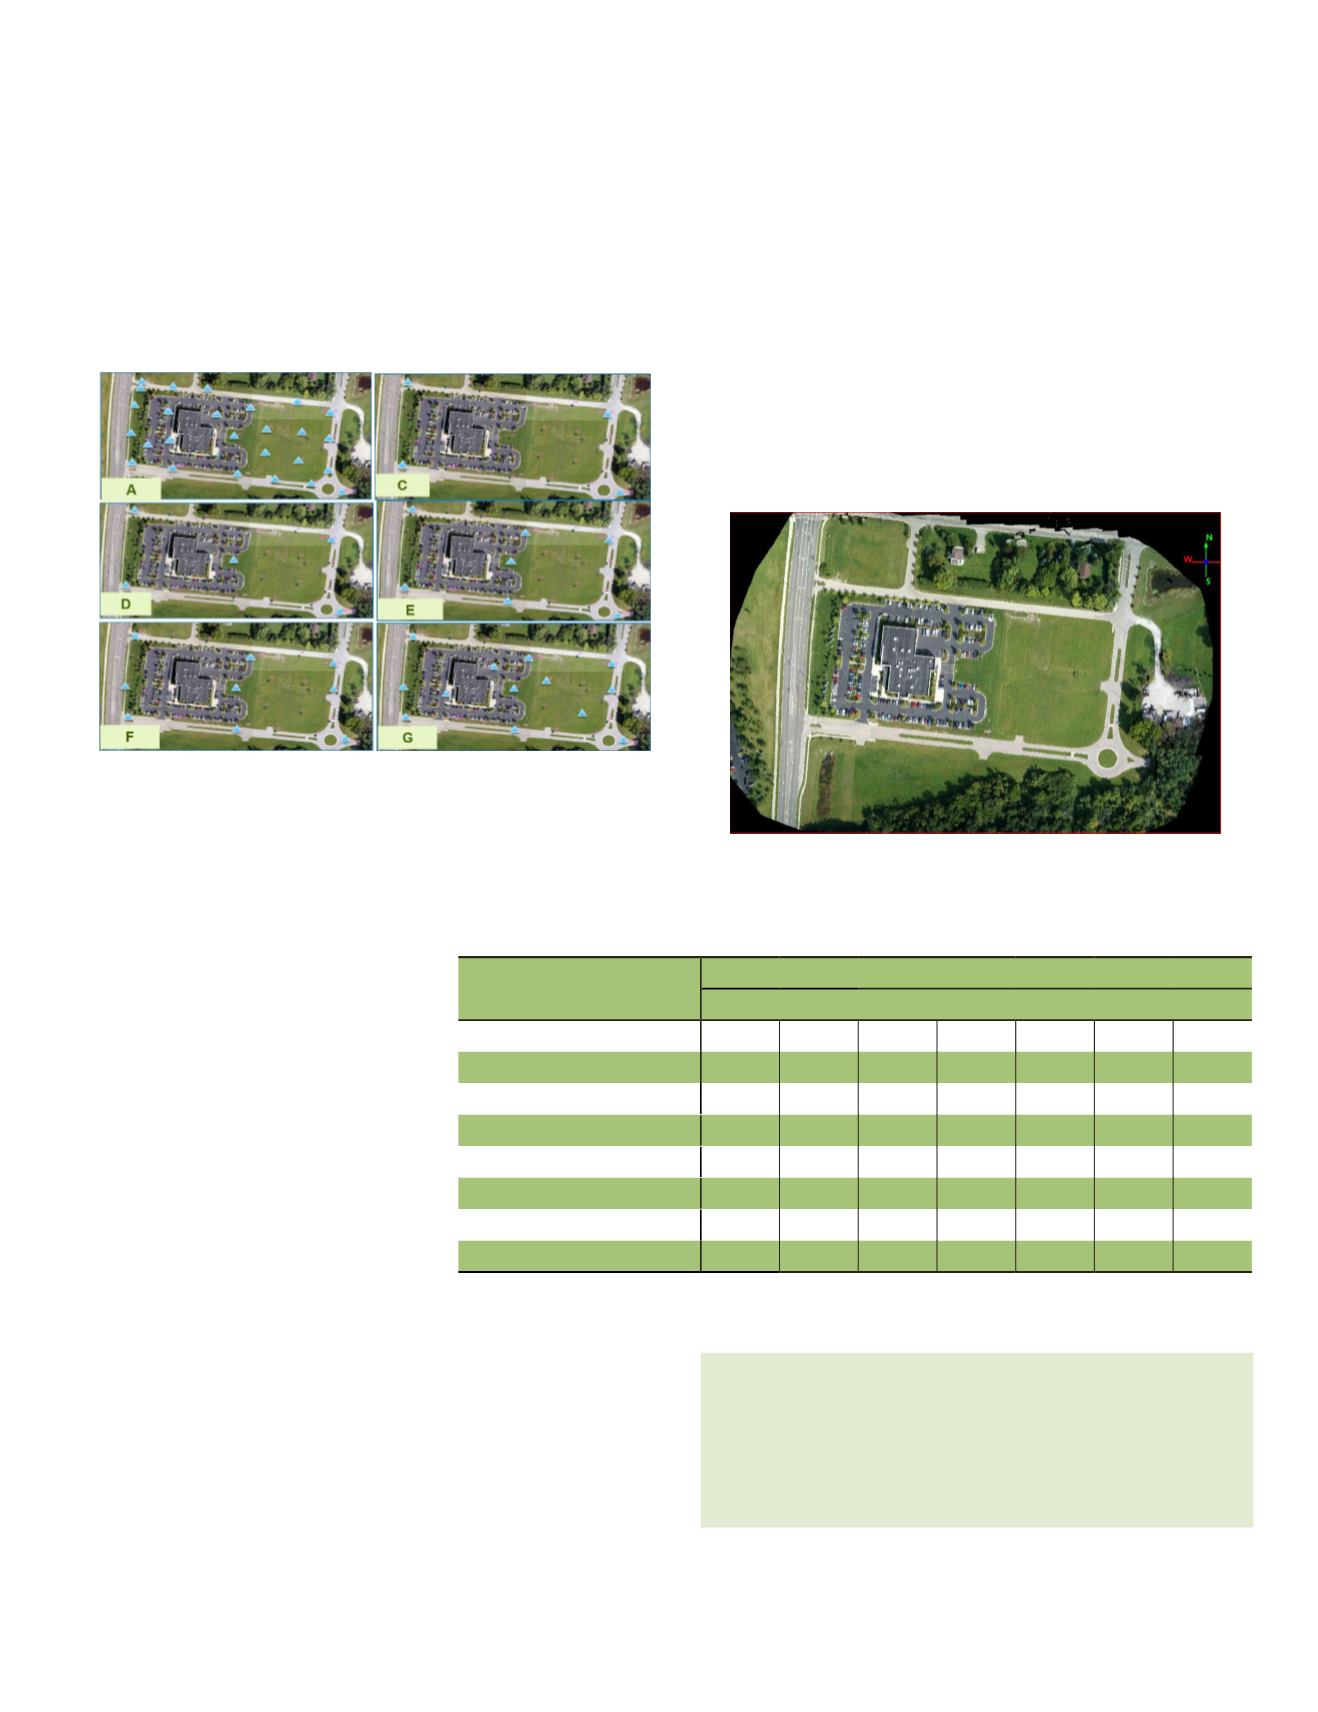
In order to evaluate positional accuracy for the Kespry-
derived products, different configurations of ground control
number and distribution were planned and executed. Seven
scenarios, A through G, were examined during the evaluation,
see Figure 5. Scenario B, where no control points were used
in the processing, is not shown in Figure 5.
CASE I — H
orizontal
A
ccuracy
E
valuation
The horizontal accuracy of the
orthorectified
imagery
was
assessed in ArcGIS for each
scenario, A through G. Ortho tiles
were imported to ArcGIS along
with the shape file containing the
checkpoints. Analysts modified the
locations in the shape files to match
eachof thecheckpoints to its location
in the orthos. Once completed,
the shape was saved and labeled
according to that scenario. Pix4D
does not yet support NAD83(2011)
datum, so the processing may
appear as if it was completed in NAD83(NSRS2007); in
reality, all the products are in NAD83(2011). As both the
ABGPS data and the ground controls were imported in their
native NAD83(2011) and NAVD88 (12A) formats, Pix4D
did not perform any internal conversion for the coordinate
systems. Table 1 lists the summary of horizontal accuracy
statistics for each of the seven scenarios.
CASE I — V
ertical
A
ccuracy
E
valuation
The vertical accuracy of the point clouds, a sample of which
is illustrated in Figure 6, for each of the seven scenarios was
assessed using TerraScan software of TerraSolid. An elevation
value was derived for each of the checkpoints from the point
cloud at the same location (easting and northing) derived
from the orthorectified imagery. Discrepancies between the
surveyed elevations and those derived from the point cloud
were computed, from which the root mean square error
(RMSE), the NSSDA accuracy figure at 95 percent confidence
level, and other statistics were computed and tabulated in
Table 1. Table 1 and Figure 7 list a summary of the vertical
accuracy statistics for each of the seven scenarios.
Figure 5: Ground controls evaluation scenarios for Case I. (The blue triangles represent
control points used in the processing.)
“careful consideration needs to be taken when dealing with
UAS-based sensors. The payload on board any small UAS,
which forms the bulk of the UAS platforms utilized by the
geospatial community, is characterized by miniaturized
design”
Figure 6: Colorized point clouds derived from the UAS-based imagery.
Table 1: Horizontal and vertical accuracy from UAS products, Case I.
Accuracy Term
Processing Scenario
A
B
C
D
E
F
G
Number of Control Points
29
0
4
5
7
9
13
Number of Check Points
20
49
45
44
42
40
36
RMSE E (ft.)
0.22
2.34
0.16
0.18
0.17
0.18
0.18
RMSE N (ft.)
0.18
1.40
0.14
0.14
0.14
0.14
0.15
Radial RMSE N,E (ft.)
0.29
2.73
0.21
0.23
0.22
0.23
0.24
RMSE Elev. (ft.)
0.32
1.62
1.35
0.32
0.23
0.25
0.29
Horizontal Accuracy at 95% (ft.)
0.49
4.72
0.36
0.40
0.39
0.39
0.41
Vertical Accuracy at 95% (ft.)
0.62
3.17
2.65
0.63
0.45
0.49
0.57


