1102
December 2014
PHOTOGRAMMETRIC ENGINEERING & REMOTE SENSING
ASPRS 2015 Annual Conference
Tampa Bay Marriott
Waterside Hotel
Tampa, Florida
May 4–8, 2015
Save the
DATE!
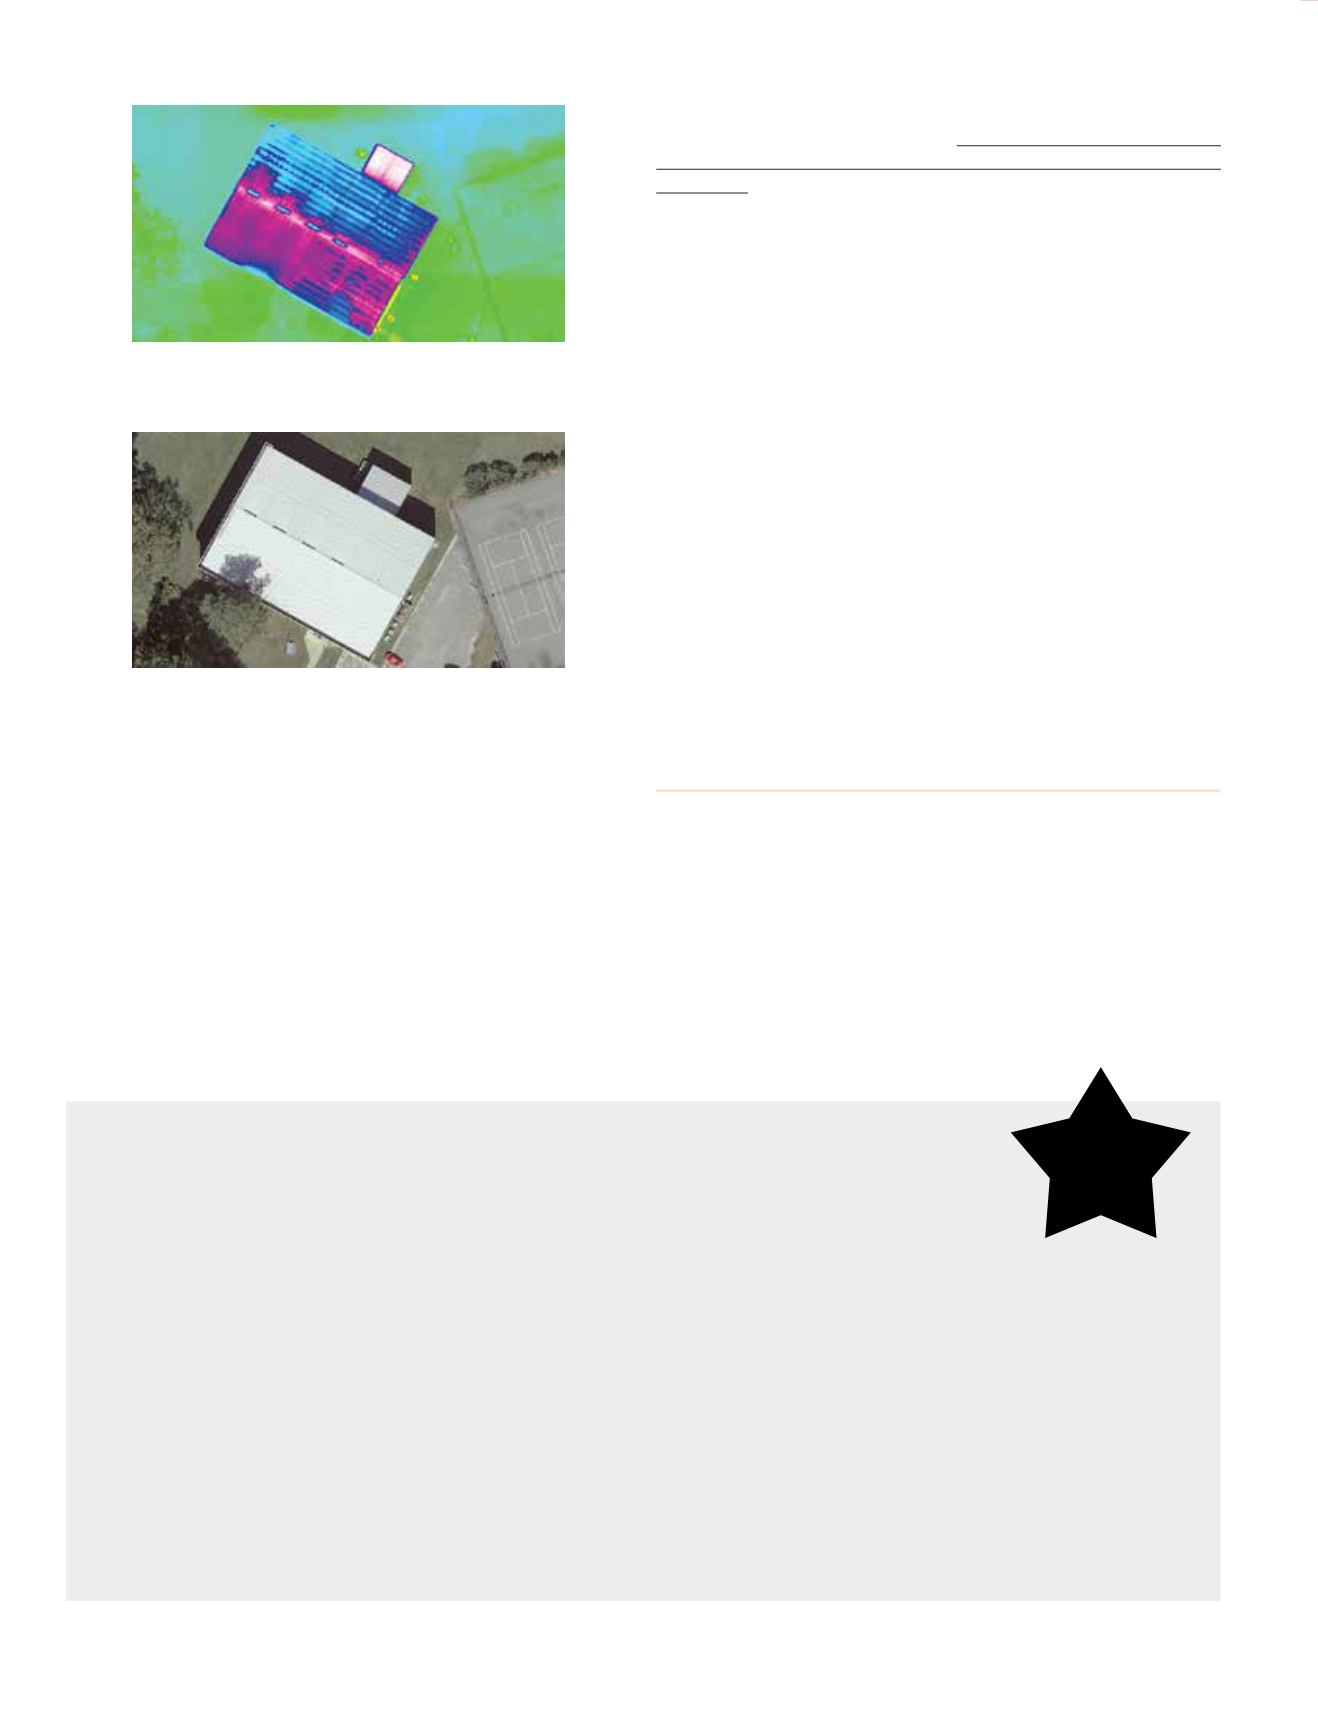
A developing trend in the use of aerial thermal imagery (long
wave IR) is for determining heat loss from building structures.
In using thermal imagery, infrastructure managers can
determine roof locations where more insulation is needed
to reduce heating costs. Figure 3a shows varying warmer
heat signatures on the north side of the roof as compared to
the cooler (violet) temperatures on the southern side of the
structure. For reference, figure 3b shows the natural color
image of the same structure.
With aerial thermal imagery providing people with insight
to the location of possible heat loss of their home or business,
my google search found a “cool” apple/android compatible cell
phone thermal camera and app to show thermal signatures. The
link was for the IR-Blue at the
/
projects/andyrawson/ir-blue-thermal-imaging-smartphone-
accessory. The IR-Blue was first developed and made available
through the Kickstarter crowd funding organization. This
Kickstarter web site is the best link to review the device and
has additional links to the RHWorkshop.com for current
purchase options (just under $200). If you are a gadget geek
or just interested in determining heat loss for your home, the
IR-Blue looks to be an interesting device to determine issues
prior to hiring a professional energy auditor.
So, what’s so hot about thermal imagery? Put simply, it
highlights heat anomalies, both hot and cold. That is why
alien predators in the movies use thermal sensors to detect the
human game they are hunting. Fortunately for us humans,
mud is a great camouflage. It both masks the heat from our
bodies, and matches the thermal emissivity of the area around
us – assuming, that is, that we are in a jungle. Mud probably
won’t save us from being eaten in the desert, but thermal
imagery would certainly help us find water.
** Imagery provided by courtesy of NASA Langley Research
Center’s GIS Team.
I would love to hear ideas for future columns.
What are you curious about?
Write me at:
*Jim Peters is a Client Development Manager at Icaros, Inc.
For ASPRS, he currently serves as the Chair for the Electronic
Communications Committee.
The contents of this column reflect the views of the author,
who is responsible for the facts and accuracy of the data pre-
sented herein. The contents do not necessarily reflect the offi-
cial views or policies of the American Society for Photogram-
metry and Remote Sensing and/or Icaros, Inc.
Figure 3a. Long-wave thermal imagery showing warmer (shades
of blue) on the north facing slope of the roof compared to the
cooler (violet) south facing slope. **
Figure 3b. The natural color image showing a metal roof building
(as seen in Figure 3a) at NASA Langley Research Center. **


