the area taken by the sliding blocks over the area of the entire
slope to evaluate the local stability of the slope, since the in-
creasing sliding area is also a triggering signal of local collaps-
es or even the slope failure. On the other hand, the percentage
of changed features in each consecutive image pair was used
to evaluate the stability of the entire slope at that time. The
percentage of changed features (
P
CF
) is defined as follows
P
N N
N N N
CF
k
k
=
+
+ −
+
1
2
1
0
(1)
where
N
k
and
N
k+1
are the numbers of features extracted from
Image
I
k
and Image
I
k+1
, respectively;
N
0
is the number of suc-
cessfully matched features using the
FBM
strategy; and
N
1
and
N
2
are the numbers of changed features of the local collapse
and sliding block features, respectively.
Generally, when the slope is stable, the
P
CF
and its variation
should be small. Otherwise, a sudden increase may indicate a
partial or entire slope failure. In the pre-failure phase, despite
an accumulation of subsurface stress, the surface displace-
ment may be small. However, during slope failure, the earth
or rock mass moves fast, and the surface morphology changes
significantly over a short time; therefore, high-frequency im-
age sequences are needed to record such processes.
Tracking for a Stereo-Image Sequence and 3D Reconstruction
All
P
CF
extracted from an image sequence are used to detect
landslide failure events, but the outcomes are limited to the 2D
image space rather than the 3D object space. Consequently, the
result cannot describe the landslide process of a realistic 3D
world. However, the 2D
FPT
method can be extended to pro-
vide 3D results if the sliding features are also matched across
the images in a synchronous stereo-pair sequence. The spatial
intersection technique can then be used to determine the 3D
positions of the feature points if the interior orientation (
IO
) and
exterior orientation (
EO
) parameters of the cameras are known.
Assume that a stereo-image sequence has two single image
sequences: Images
I
k
(
k = 1, 2, 3, ... N
) and Images
J
k
(
k = 1,
2, 3, ... N
). Image
I
k
and Image
J
k
are captured by a synchro-
nized camera pair at time t
k
and compose a stereo-image pair.
The strategy is to perform FPT on the single-image sequence,
Images
I
k
(or Images
J
k
), to extract as many sliding features as
possible. Then, the feature points in the single-image se-
quence
I
k
are matched with the corresponding points in the
single-image sequence
J
k
. The successfully matched sliding
features in the stereo images can be positioned in the 3D ob-
ject space. Additionally, the velocities of the sliding features
can be calculated according to the 3D coordinates from the
stereo-image sequences.
Image Orientation
The base-depth ratio is relatively small (from 1:1.7 for the toe
of the slope to 1:8.0 for the top of the slope) for the two
HSCS
cameras due to the restrictions of the experiment environment
(shown in Plate 1), corresponding to an image resolution of
0.74 mm to 2.76 mm over the landslide surface. All cameras
used to collect images are calibrated indoors prior to the ex-
periments using PhotoModeler software (PhotoModeler, 2013).
Thus, the lens distortions and
IO
parameters of the cameras are
known. Eight of the thirteen GCPs that are coded targets (see
targets inside the green frames in Plate 2f) are used to compute
the
EO
parameters of the images taken by the stereo cameras
through a bundle adjustment procedure. The five remain-
ing GCPs were used as check points. Because the cameras
are expected to remain stable during the experiment, the
EO
parameters are calculated for the initial image pairs and then
applied to all subsequent pairs. The accuracy discussion of the
orientation and ground positions is given in a later section.
Matching Sliding Features in the Stereo-Image Sequence
The second stage searches corresponding features of the slid-
ing block in the stereo image sequence
I
k
,
J
k
(
k=
1
,
2
,
3
, ... N
).
For a specific stereo-image pair (left Image
I
k
and right Image
J
k
), we search for the corresponding features in the right image
(Image
J
k
) that correspond to the sliding features in the left
image (Image
I
k
). This matching process is also performed in
the opposite direction from image
J
k
to image
I
k
. After estab-
lishing the
IO
parameters and
EO
parameters, the epipolar line
in the right image is determined according to a sliding feature
from the left image (Image
I
k
). Then, the search can be limited
within a few rows adjacent to the epipolar line (Hartley and
Zisserman, 2006; Di
et al
., 2008).
We expect that the sliding features in the left image
sequence are highly likely to have corresponding points in
the right image sequence. Because these points are extracted
SIFT
features, the first matching attempt is based on the
FBM
technique to compare the
SIFT
descriptors in the two stereo-
image sequences. For example, for a sliding feature in the left
image, we define a corresponding window in the right image
that is along the epipolar line but extended to a rectangle by
considering the above search limitation. The
SIFT
descriptors
of all candidates within the search window are compared
with the descriptor of the sliding feature in the left image. By
comparing the absolute norm of the descriptor vector, the best
match is selected as the corresponding point. If no matched
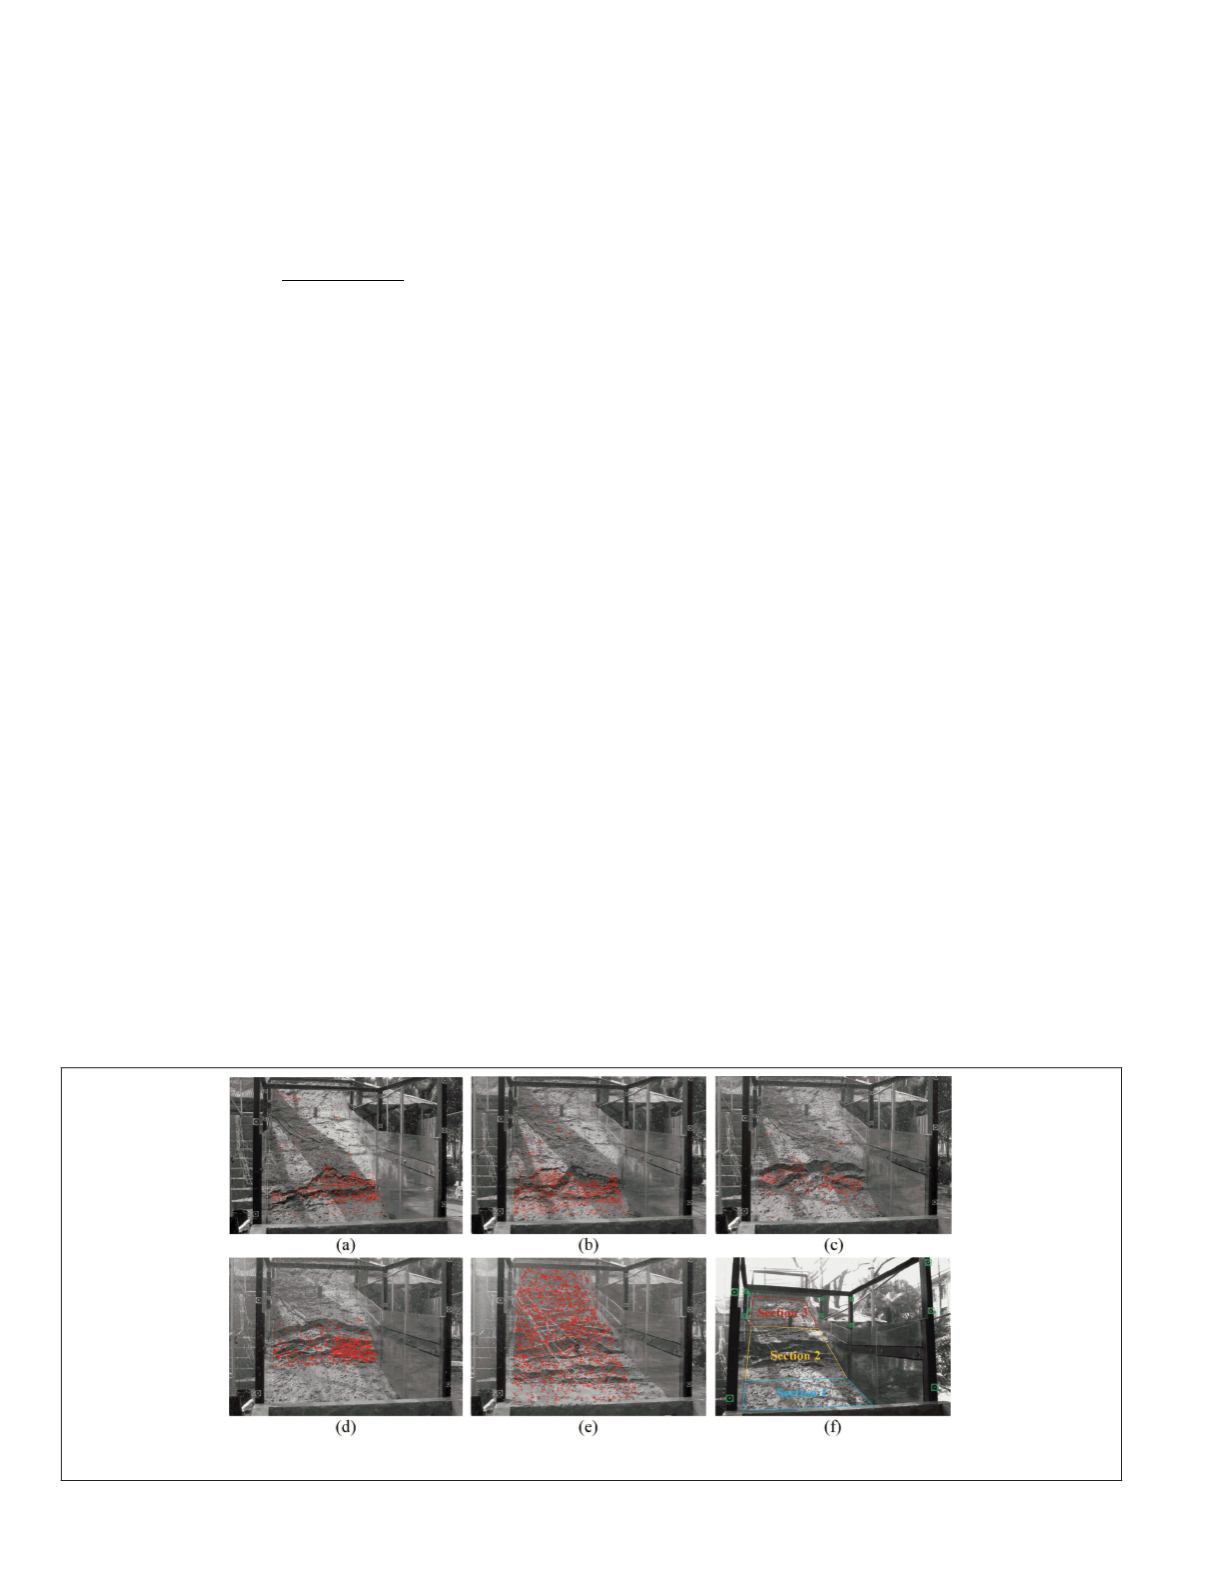
Plate 2. (a) to (e) are detected altered features from images captured by the SLRC camera system for all five events in Figure 3, and (f)
shows three sections of the scaled-down slope and GCPs marked by green boxes.
550
July 2016
PHOTOGRAMMETRIC ENGINEERING & REMOTE SENSING


