platform that required an interruption. It is obvious that the
area of the sliding blocks increased continuously with small
fluctuations. Although the sliding blocks caused the local in-
stability, they did not have a periodic change pattern. Howev-
er, when the area change rate of the sliding blocks approached
70 percent the final collapse was triggered.
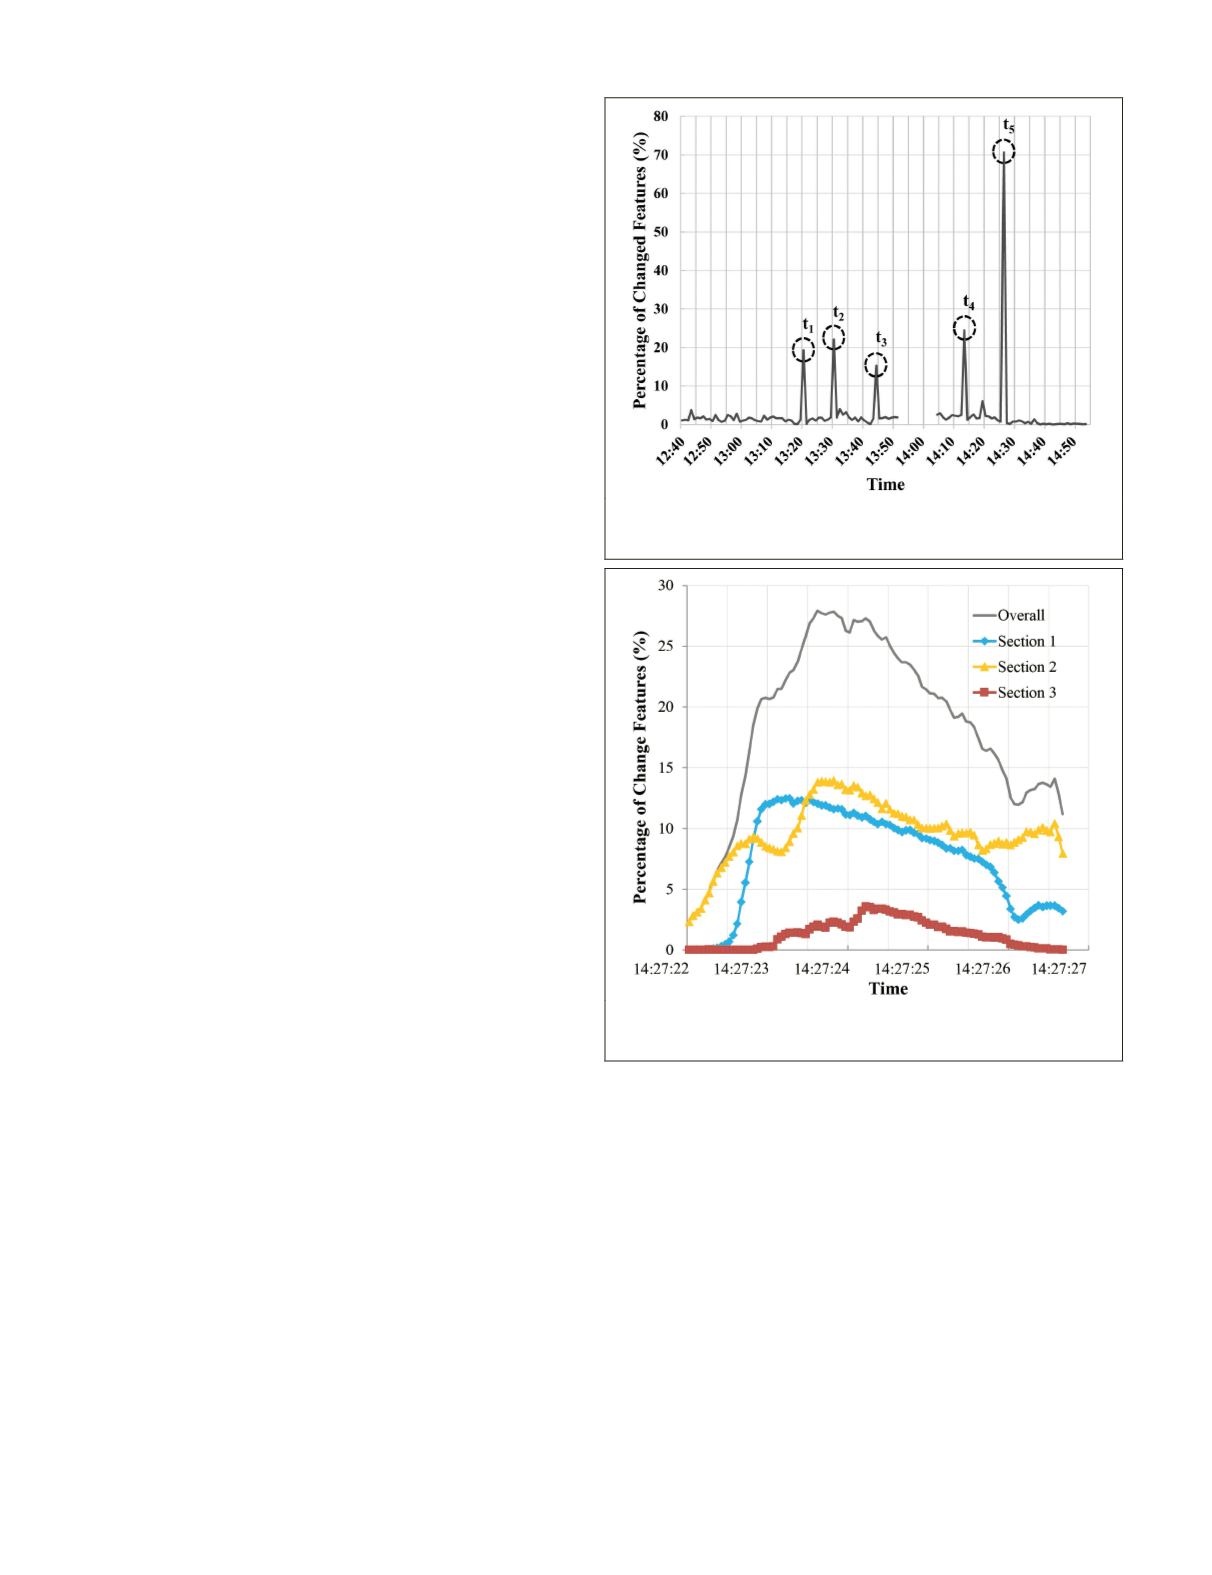
Figure 3 presents a histogram of
P
CF
versus imaging time.
The percentage of changed surface features can be used to in-
dicate events associated with local collapses or slope failure.
The
P
CF
value was relatively small (usually <5 percent), with
some fluctuations between 12:40 and 13:20 (Figure 3). These
fluctuations were related to small changes in the slope surface
caused by the initial precipitation during the unsaturated
stage of the landslide mass. The slope body was relatively sta-
ble. A sudden increase in
P
CF
to approximately 20 percent (the
black-dashed circle at
t
1
in Figure 3) occurred at approximate-
ly 13:21, indicating a local collapse of the landslide surface
caused by partial super-saturation of the earth after a 40-min-
ute water accumulation. The landslide then returned to a
relatively steady status, with a
P
CF
of less than 5 percent. This
stage was followed by small changes; then, two
P
CF
peaks of
approximately 22 percent at 13:31 (
t
2
) and 16 percent at 13:45
(
t
3
) indicated additional local surface collapses. Disregarding
the missing data period, a similar pattern of local collapses
occurred afterwards, with a
P
CF
peak of approximately 23 per-
cent at 14:14 (
t
4
). Up to that point, the entire landslide mass
gradually became saturated, which increasingly destabilized
the landslide body and encouraged collapse. The final failure
of the slope occurred at 14:27 (
t
5
), when the
P
CF
increased
dramatically to a maximum of approximately 70 percent. In
the final 30 minutes of the experiment, the
P
CF
exhibited very
small changes and then decreased to nearly zero. This obser-
vation indicates that the landslide surface remained nearly
unchanged because the energy of the landslide body had been
completely released. In Figure 3, the
P
CF
prior to each of the
five peaks is small, which suggests that in a rainfall-triggered
landslide setting, a period of internal energy accumulation is
required. In this process the shallow materials of this multi-
layer slope may be saturated first after rainfall. As a result,
several fissures appeared on the surface, as shown in Plate 2.
Then, the water penetrated into deep materials of the lower
layer through the narrow fissures. This process combined with
the slope difference of the bed sections results in the uneven
saturation along the slope, which then can lead to the devel-
opment of positive interstitial pressures at different times in
this study. The similar phenomena were also shown in field
experiments in Friedel
et al
. (2006) and Brönnimann
et al.
(2013). Once the accumulated saturation reaches a critical
level, the slope becomes unstable, and local collapse or slope
failure can be triggered. The five local collapses and slope fail-
ure events detected by the
P
CF
analysis were consistent with
the visual interpretation results using the images.
Plate 2 illustrates detected altered features for all five
events in Figure 3 at 13:21, 13:31, 13:45, 14:14, and 14:27 and
three sections of the scaled-down slope. The changed features
in the local collapses in Events 1 and 2 were primarily situ-
ated around the landslide fissures that appeared at the bottom
of the slope. The locations of the altered features then moved
up to some extent in Events 3 and 4. At slope failure, the al-
tered features were distributed across all sections, indicating
an overwhelming change in the entire slope surface.
Analysis of the Slope Failure Process Based on HSCS Stereo-Image
Sequences
The
SLRC
provides an overview of the general landslide pro-
cess for detecting deformation events but cannot be used to
examine the slope failure dynamics in detail because of the
relatively low frequency of the image acquisition (six frames/
min) and the very short duration (a few seconds) of the final
failure process. Therefore,
HSCS
stereo-image sequences with
a higher imaging rate of 20 frames/S were used for the FPT in
the 2D image space and to construct instantaneous deforma-
tion velocity fields in the 3D object space.
Accelerated Surface Changes Detected by FPT from
HSCS
Image Spaces
The final slope failure lasted approximately five seconds, dur-
ing which 95
HSCS
stereo image pairs were captured between
14:27:22.00 and 14:27:26.75. To analyze the surface changes
in detail, the landslide body was divided into three sections
according to the inclinations of the scaled-down slope (see
Plate 2f). The
P
CF
in each section was then determined for the
entire period and plotted jointly in a histogram in Plate 3. For
all sections, a three-stage pattern similar to that of the entire
landslide slope was observed, although the patterns occurred
at different levels and times.
In implementation,
FPT
was first applied to generate the
changed features; then, the
P
CF
values derived from the im-
age sequence of the left
HSCS
camera were used to depict the
failure process (grey line in Plate 3). The
P
CF
values from the
Figure 3. Histogram of
P
CF
versus imaging time as derived from
the sequence of SLRC images. The local collapses and final slope
failure are indicated by the black dashed circles.
Plate 3. Histogram of PCF versus imaging time during the final
slope failure period derived from the FPT analysis using the HSCS
image sequences.
552
July 2016
PHOTOGRAMMETRIC ENGINEERING & REMOTE SENSING


