that pass the test of our algorithm is provided in column
A2
,
and the number of correct matches in them is provided in
column
B2
. The large amount of false matches are removed,
whereas most of the correct matches are preserved.
The correct ratio after using our method is influenced by
the criteria of deciding which bins are correct bins. As men-
tioned above, in our method, a bin is viewed as a correct bin if
and only if it is within ±3 bins from the peak bin, and its votes
should not be less than 40 percent of the peak bin. The method
of deciding correct bins is important. Extremely strict condi-
tions would remove many correct matches, whereas extremely
loose conditions would involve many false matches. The
criteria used in our method can reach a balance. Furthermore,
considering that our method is a preprocessing step, a postpro-
cessing method (
LMedS
) that uses epipolar constraint will be
used afterwards, and it can remove the rest of the outliers.
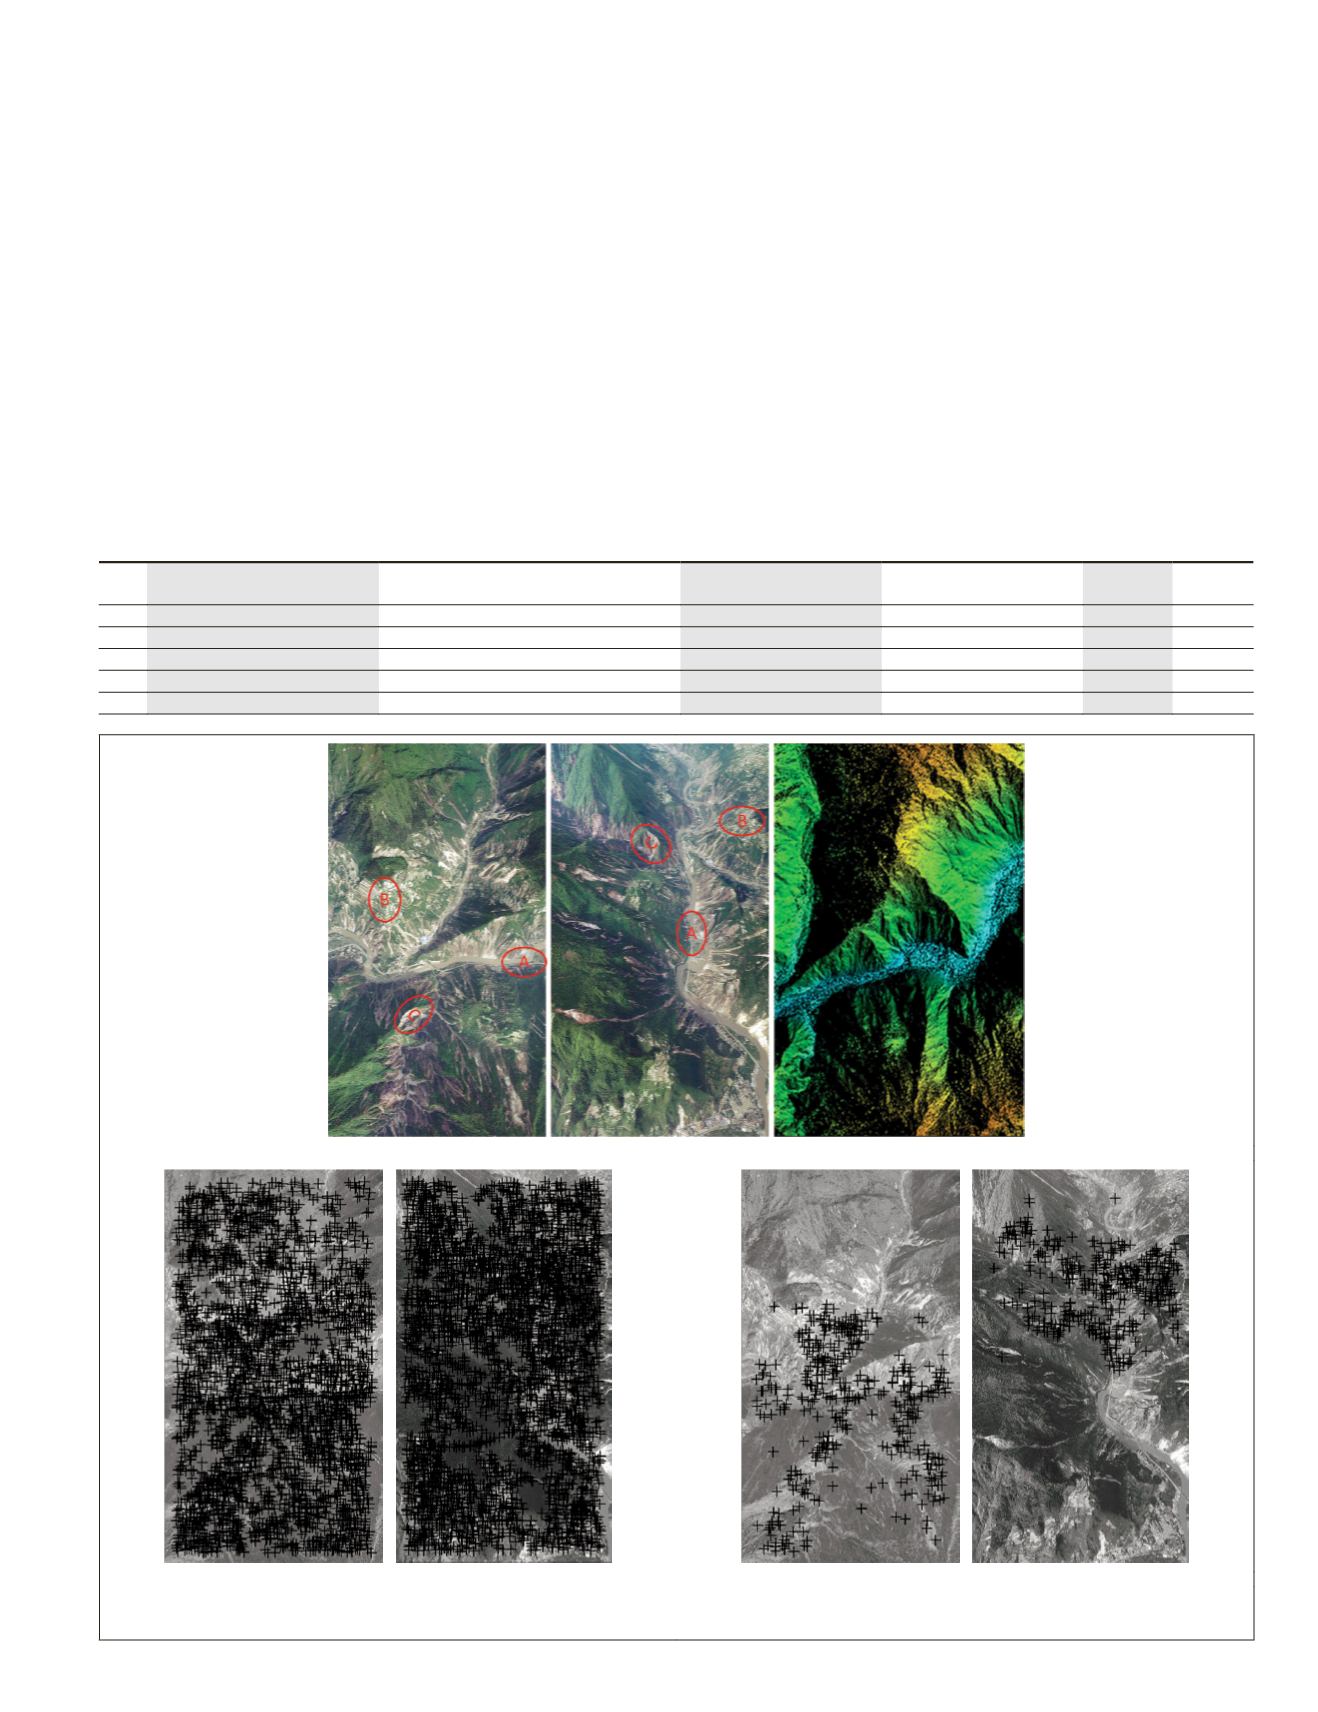
Plate 1 provides the distribution of matches of Data 5
before and after filtering using our algorithm. Plate 1a pres-
ents the original images and the digital surface model of the
scene. The images were captured from different angles, and
the scene is a mountainous area with a rapidly varying eleva-
tion. Plate 1b provides the distribution of the initial matches,
whereas Plate 1c presents the distribution of the matches after
filtering. The result proves the quality of our algorithm.
Scope of Application of our Algorithm to Different Imaging Situations
We may encounter many different imaging situations in
practice, such as images with large perspective effects, planar
scenes viewed obliquely, and images with large-scale differ-
ence. To show that our algorithm can handle such situations,
representative matching results are provided in the following
section. The distribution of votes is a good indication of the
robustness of the algorithm, that is, a voting result with one
outstanding peak indicates a good reliability of the result.
Thus, the distribution of votes of these test data is provided
along with the matching results.
Similar to the previously described process, considering
that angle is periodic and to make it more convenient for read-
ers to see the distribution of votes, the image of the accumulate
T
able
1. P
erformance
of
the
C
andidate
M
atches
F
ilter
P
roposed
in
this
P
aper
Data
No.
A1
(Number of Initial Matches)
A2
(Matches selected by our Algorithm)
B1
(Correct Matches in
A1
)
B2
(Correct Matches in
A2
)
Ratio 1
( B1/A1 )
Ratio 2
( B2/A2 )
1
154,208
28,568
12,803
11,479
8.30% 40.18%
2
144,736
13,438
7,177
6,103
4.96% 45.42%
3
110,776
11,255
5,695
4,849
5.14% 43.08%
4
141,736
8,216
3,974
3,329
2.80% 40.52%
5
151,992
7,671
3,129
2,590
2.06% 33.76%
(a)
(b)
(c)
Plate 1. Distribution of matches before and after filtering using our algorithm: (a) The original images and DSM, (b) Matches before filter-
ing, and (c) Matches after filtering.
PHOTOGRAMMETRIC ENGINEERING & REMOTE SENSING
July 2016
565


