determine whether or not there is a significant difference in
accuracies for the dead conifer class between the cumulative
inputs (
n
= 74) of transforms alone, as compared to the inputs
of transforms added to the spectral bands. The accuracies are
significantly different at the 0.001 level (
p
<0.0001), with the
products of the transforms added to the spectral bands having
higher accuracies than those of the transforms alone.
When comparing the classification results from different
transformed image inputs for the spatial contextual approach,
five products exhibited higher accuracies over the spectral
bands alone, based on mean accuracy and in most cases mean
commission error (Table 5). These products include those
based on
NDGR
+ spectral bands,
VARI
+ spectral bands, the
combination approach, and
PCA
+ spectral bands (see Table
6 to view the mean accuracy values for all of the derived prod-
ucts in order from highest accuracy to lowest). The improve-
ment from the
NDGR
+ spectral bands product in comparison
to those from spectral bands is only an increase of 13.4 per-
cent in mean accuracy, and a decrease in mean commission
error of 8.3 percent. When comparing accuracies for the dead
conifer class between the cumulative inputs (
n
= 74) of trans-
forms alone, as compared to the inputs of transforms added to
the spectral bands, the student t-test result indicates that there
is a significant difference (at the 0.001 level) between results
(
p
<0.0001), with again, the products of the transforms added
to the spectral bands having higher accuracies than those of
the transforms alone.
The accuracies of the spatial contextual classification
products were higher when a masking technique was imple-
mented, prior to the addition of transforms. An enhanced map
product was created using a non-forest mask layer to exclude
areas of non-interest prior to classification for the spatial con-
textual approach. The products from the masking procedure
compared to the non-masked products exhibited an increase
in mean accuracy of 20.3 percent, and a decrease in the mean
commission error of 4.3 percent (Table 7).
The overall accuracy for dead tree classification products
ranged in value from 24 percent to 92 percent for the object-
based accuracies (Table 8). A paired student t-test comparing
the accuracies of the two approaches, for all products, indi-
cates that the accuracies for the spatial contextual products
were significantly higher than the object-based products at the
0.01 level (
p
= 0.0033). The commission errors are not signifi-
cantly different between the two products (
p
= 0.6). Therefore,
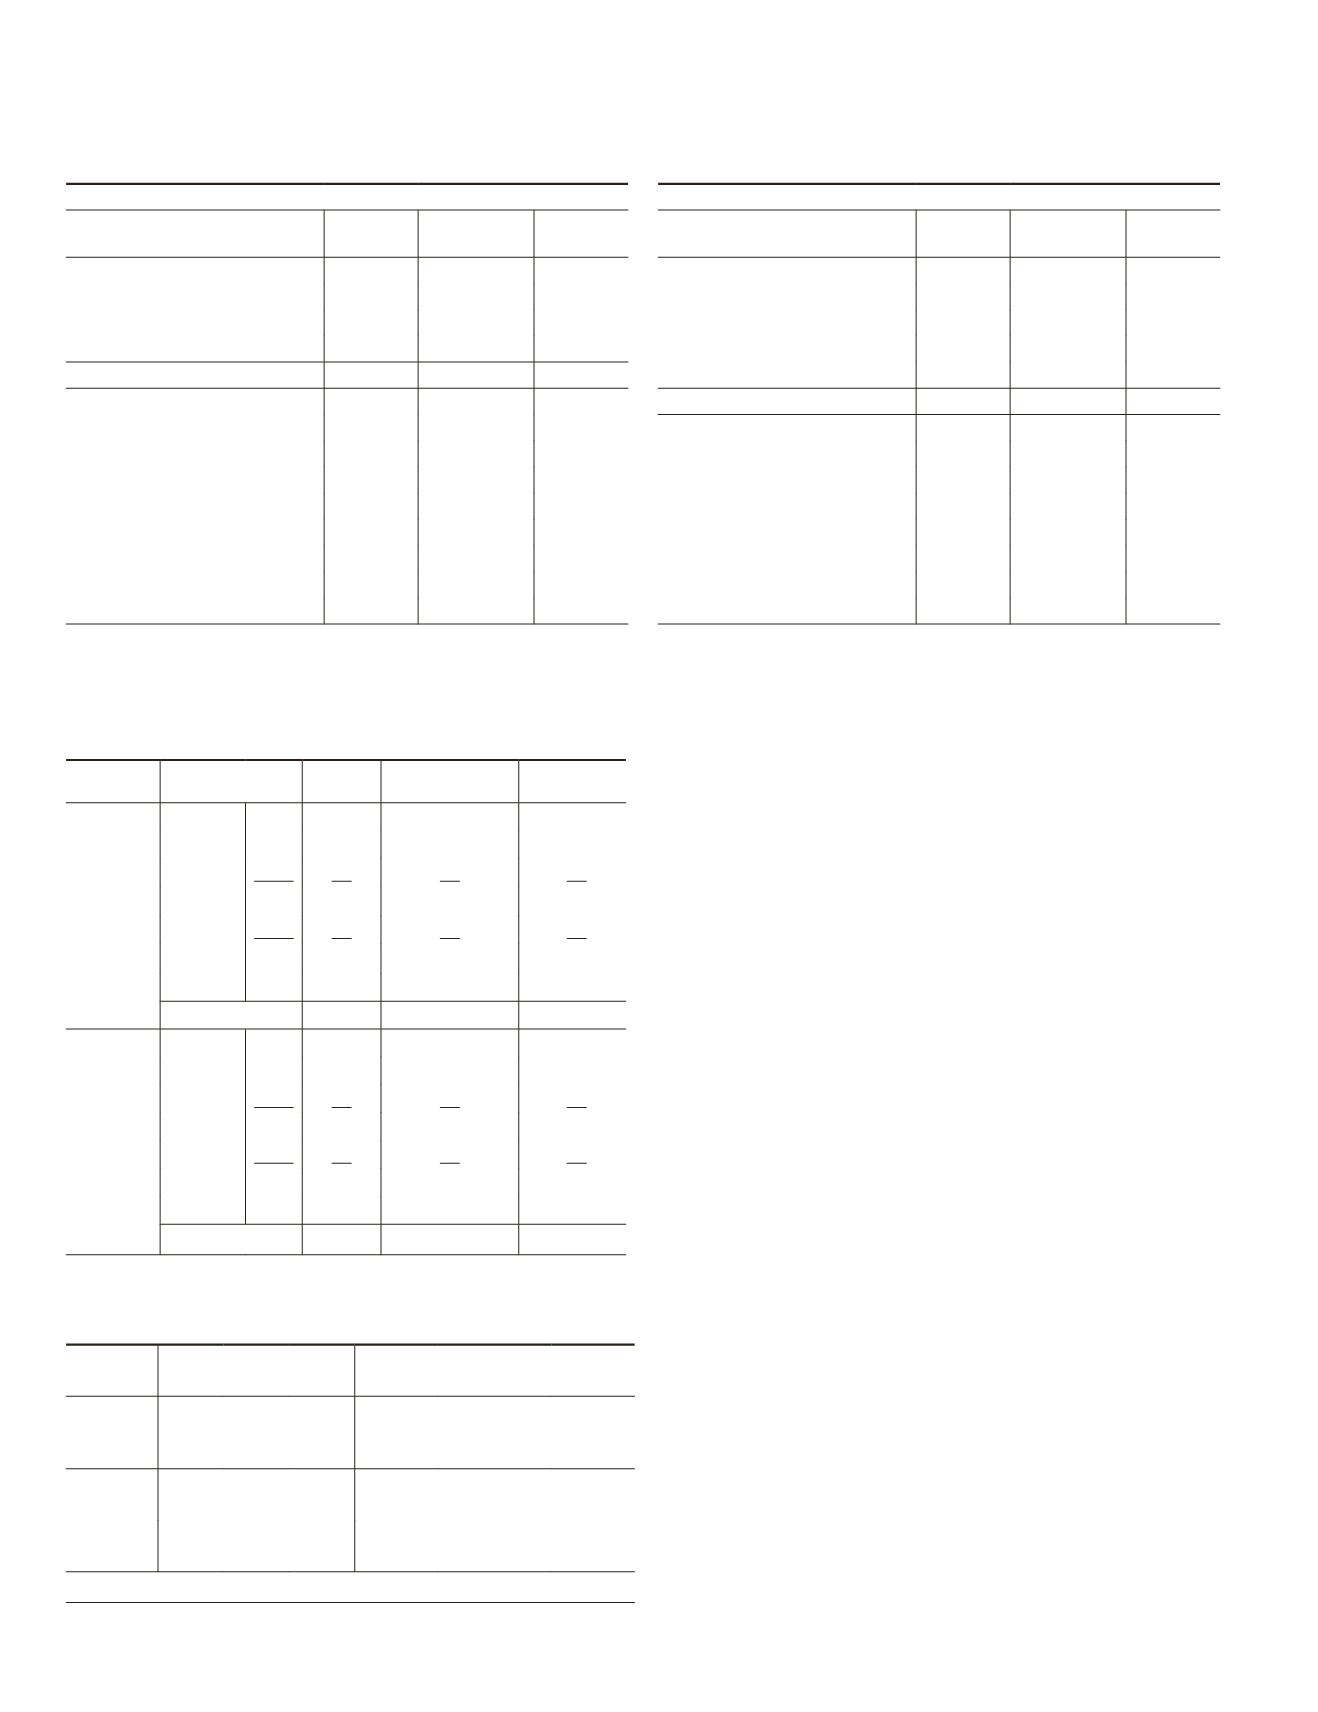
T
able
6. A L
ist
of
the
M
ean
V
alues
for
C
lassification
P
roduct
A
ccuracy
M
easures
(C
ompiling
R
esults
for
E
ach
D
ate
of
I
magery
and
E
ach
S
tudy
A
rea
),
C
omparing
O
verall
P
erformance
of
T
ranformations
A
dded
to
S
pectral
B
ands
, T
ranformations
A
lone
,
and
S
pectral
B
ands
A
lone
,
for
E
ach
A
pproach
. T
he
C
lassification
R
esults
are
L
isted
in
O
rder
of
H
ighest
to
L
owest
M
ean
A
ccuracies
, T
op
to
B
ottom
, R
espectively
OBJECT-BASED (ECOGNITION)
Classification product
mean
accuracy
mean
commission
mean
omission
Combination
65.7
47.1
34.3
PCA + spectral bands
64.6
36.0
35.4
NDGR + spectral bands
63.4
42.9
36.6
NDVI + spectral bands
60.5
47.0
39.5
Spectral bands only
60.3
49.4
39.7
Simple ratio + spec. bands
59.5
51.5
40.5
SAVI + spectral bands
58.5
46.5
37.0
VARI + spectral bands
58.0
48.7
42.0
PCA transform only
57.7
48.6
42.3
NDVI transform only
56.0
49.5
44.8
NDGR transform only
50.0
43.0
50.0
Simple ratio transform only
40.0
44.0
60.0
VARI transform only
39.5
41.0
60.5
SAVI transform only
39.5
48.5
60.5
SPATIAL CONTEXTUAL (FEATURE ANALYST)
Classification product
mean
accuracy
mean
commission
mean
omission
NDGR + spectral bands
79.1
38.6
20.9
VARI + spectral bands
71.0
45.0
29.0
Combination
69.4
41.4
30.6
PCA + spectral bands
68.0
44.3
32.0
PCA transform only
67.7
55.1
32.3
Spectral bands only
65.7
46.9
32.3
SAVI + spectral bands
61.0
42.0
39.0
VARI transform only
50.0
40.0
42.5
NDGR transform only
49.1
49.1
50.9
NDVI + spectral bands
38.9
47.5
32.0
SAVI transform only
37.5
47.0
39.0
Simple ratio + spec. bands
37.4
48.0
34.5
Simple ratio transform only
34.3
53.0
40.0
NDVI transform only
30.9
52.5
46.0
T
able
8. P
robabilities
from
t
-
test
A
nalyses
C
omparing
A
ccuracy
R
esults
of
C
lassifications
by
I
magery
D
ate
and
I
magery
S
cene
(S
tudy
S
ite
),
for
B
oth
S
oftware
A
pproaches
Comparing
Imagery dates
Comparing Imagery scenes
Type of
Classifier
2002/
2005
2002/
2007
2005/
2007
Palomar
to
Laguna
Laguna
to
Volcan
Palomar
to
Volcan
Object-
based
0.6699 0.6361 0.5379 0.2253 1.2725E -07** 0.0003**
Spatial
Contextual
0.0682 0.2602 0.9532 0.1788 0.0017* 0.1089
* significant at the .01 level, ** significant at the .001 level
T
able
7. D
ead
C
onifer
T
ree
C
lassification
A
ccuracies
for
the
S
patial
C
ontextual
(F
eature
A
nalyst
) C
lassifier
, C
omparing
the
R
esults
for
the
C
lassification
C
onducted without
a
M
ask
,
and
A
pproach
U
tilizing
a
N
on
-
F
orest
M
ask
P
rior
to
C
lassification
. T
he
T
op
T
wo
A
ccuracy
V
alues
are
in
B
old
for
E
mphasis
,
for
E
ach
A
pplication
.
Technique
Imagery
%
Correct
% Commission
error
% Omission
error
Classification
without mask
Palomar
2002 50
34
50
2005 32
58
68
2007
70
28
30
Volcan
2002 52
34
48
2005
68
66
32
Laguna
2002 24
76
76
2005 22
62
78
mean = 45.4
51.1
46.9
Non-forest mask applied
prior to classification
Palomar
2002 60
34
40
2005 60
70
40
2007
88
32
22
Volcan
2002 64
34
36
2005
76
70
24
Laguna
2002 46
42
54
2005 66
46
34
mean = 65.7
46.9
35.7
576
July 2016
PHOTOGRAMMETRIC ENGINEERING & REMOTE SENSING


