to characterize the vegetation and fused that with radar data to
build their empirical model. However, most of these models
are still best applied in the settings under which they were
developed and require significant adjustments when applied
elsewhere. Though studies continue it would appear that a
universal model is far off (Kim, 2009; Mattia, 2009; Kim, 2012).
Vegetated surfaces, such as those in our study area, present
even more complexity to the situation, and contribute to radar
backscatter. Attempts to derive soil moisture under vegetation
cover are quite varied, and different methods based on different
radar bands such as L, C, and X have been developed (Bindlish,
2001; Hajnsek, 2009; Kseneman, 2011). L-band radars operate
on a wavelength of 15 to 30 cm and a frequency of 1 to 2
GHz
.
Due to their longer wavelength, an L-band radar has maximum
penetration capability through vegetation cover and also into
dry soil. C-band radars operate on a wavelength of 4 to 8 cm
and a frequency of 4 to 8
GHz
. Their penetration capability is
limited but slightly better than X-band. The X-band is a wave-
length of 2.5 to 4 cm or a frequency of 8 to 12
GHz
. Because of
the smaller wavelength, it has very limited penetration and
volume scattering from the vegetation canopy. Most studies to
retrieve soil moisture from radar therefore rely on L band data
(O’Neill, 1995; Shi, 1997; Hajnsek, 2009; Prakash, 2012).
In this study, we develop a machine learning algorithm
to estimate soil electrical conductivity (
EC
) over a levee area
from X-band
SAR
observations acquired by the TanDEM-X
satellite (Düring, 2008). The
EC
values could then be used to
estimate soil moisture using well-established relationships
between
EC
and water content (Reedy, 2003; Akbar, 2005;
Huth, 2007). Because we were only interested in relative
spatial variations of soil moisture,
EC
measurements were
used for our reference data rather than a direct measurement
of soil moisture since it can be collected very efficiently over
broad areas. TanDEM-X and its twin satellite Terra
SAR
-X offer
the highest spatial resolution
SAR
data currently available
from a spaceborne platform (Düring, 2008). This data is ideal
for studies at a local scale for monitoring events with small
spatial extent such as levee slides.
The use of a machine learning algorithm differs from
approaches based on inversion of physical models by not
requiring explicit estimation of model parameters. Instead,
knowledge of the physical models informed the selection of
mathematical features used in the algorithm. For example, im-
age texture types of features respond to variations in surface
roughness, which is a parameter in these physical models.
Although there are some models that used machine learning
algorithms to estimate soil moisture (Paloscia, 2013; Santi,
2013), our work is different from these methods in that we are
using X-band
SAR
data (in previous work, C and L band were
used). We used texture features (not used in previous work),
and we apply a wavelet and back propagation neural network
(not used to estimate soil moisture in previous work).
Study Area and Data Set
Our study covers approximately a 300 km stretch of mainline
levee along the Mississippi River bordering Mississippi, Ar-
kansas and Louisiana within which 29 slide events from 2008
to 2011 have been reported by the Mississippi Levee Board.
Most of these slides were reported in October 2009 which also
coincides with the second wettest month in Mississippi and
the wettest month in Arkansas since record keeping began in
1895 (National Climatic Data Center, 2009). The field-based
monitoring method across such a large expanse of levee is
time consuming and costly even when it is carried out once
per calendar year. To do this with every large precipitation
event would be even more challenging and require allocation
of substantial technical, financial, and personnel resources.
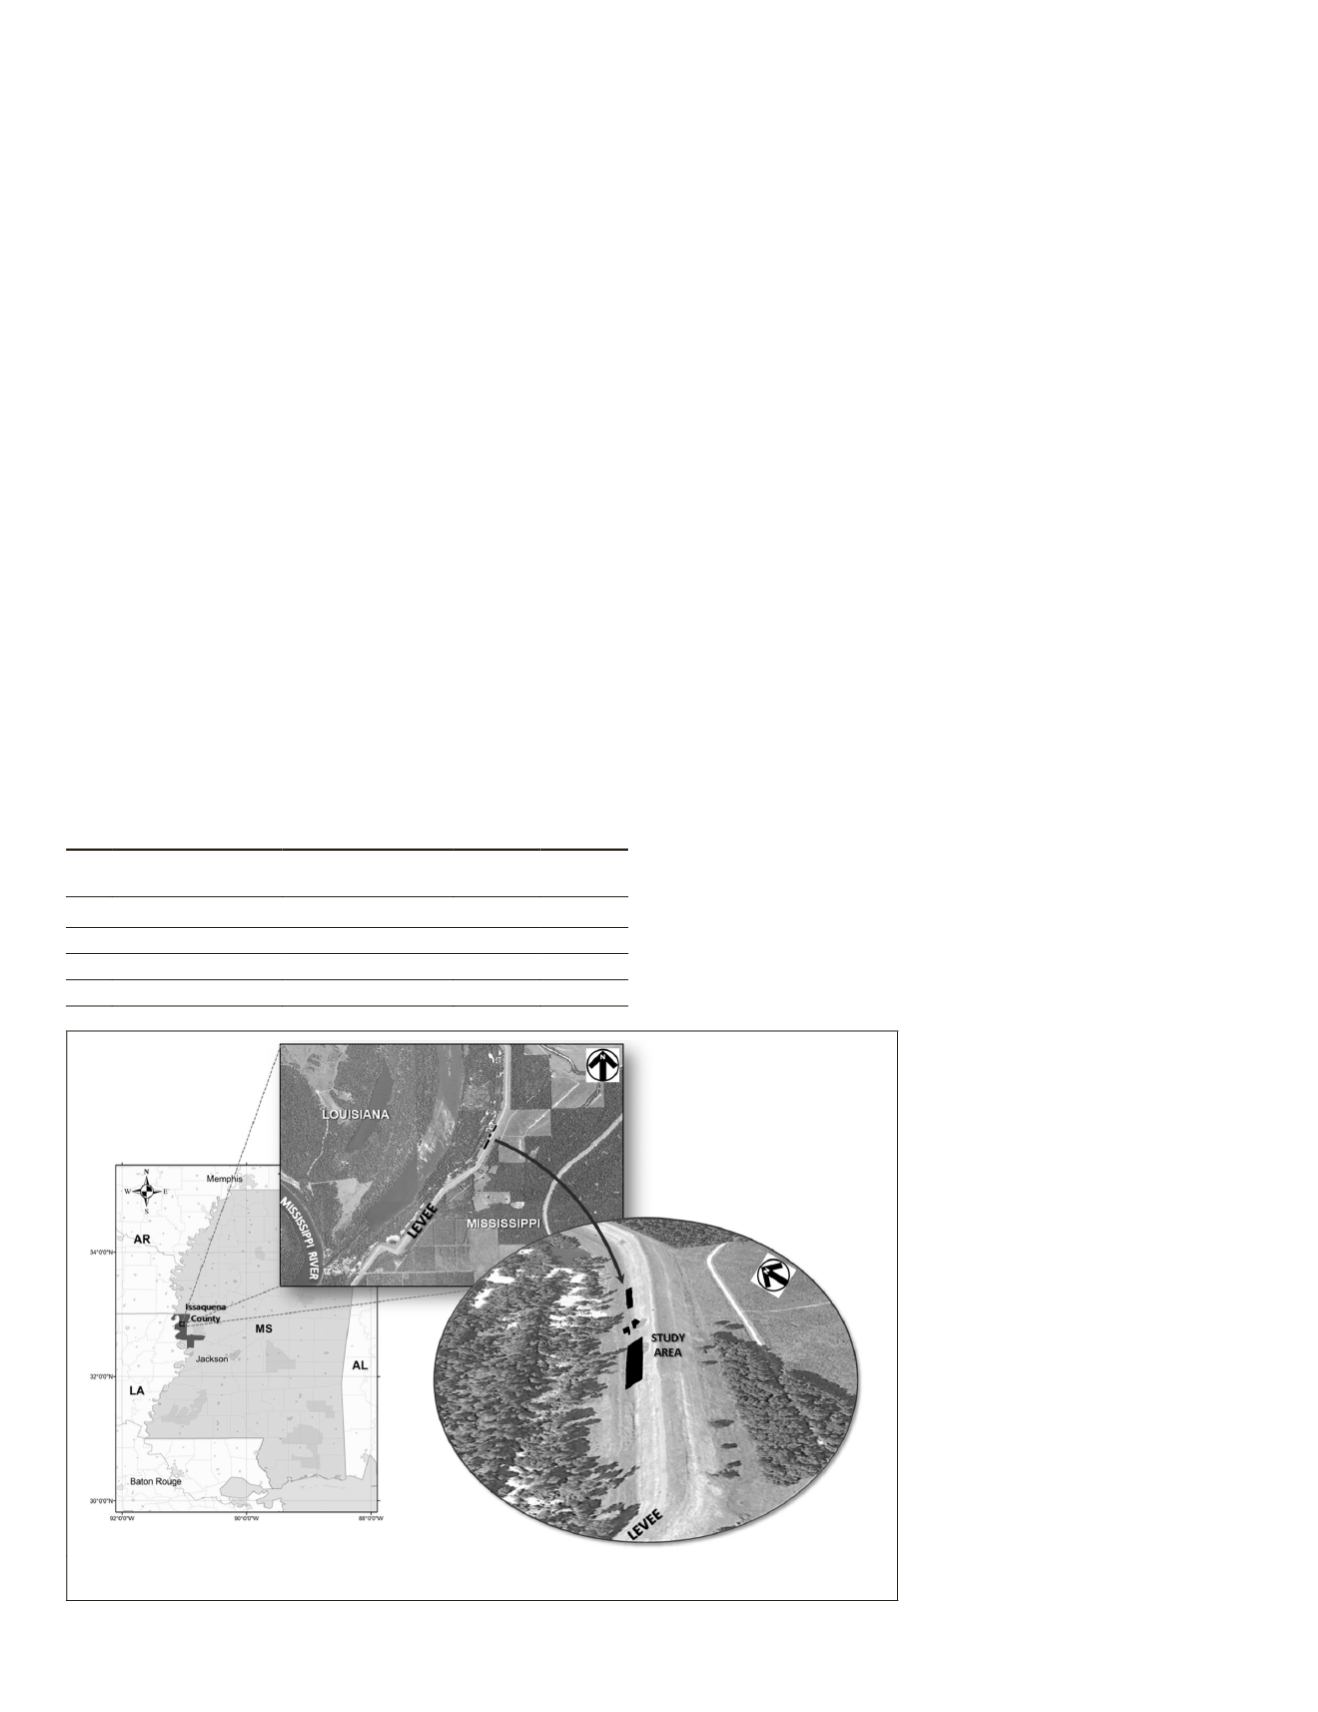
In this study, the investigation was conducted on the
earthen levee system of the Mississippi river near Chotard
Lake on the border of Mississippi and Louisiana. The study
area includes four areas of interest (
AOIs
) located in Is-
saquena County, Mississippi, between latitude 32°36'07"N
and 32°37'35", and longitude
91°01'32"W and 90°59'30"W.
Table 1 provides more details on
each of the
AOIs
. In cross-section,
the levee in the study area is 10
meters high and about 60 meters
wide. The slope is typically 25
percent on the river side and 16
percent on the land side (Wolff,
2002). Figure 1 illustrates the lo-
cation of the study area, as well
as the oblique perspective of the
levee derived from a lidar-based
Digital Elevation Map (
DEM
) and
an optical image from the
USDA
National Agriculture Imagery
Program (
NAIP
) acquired in 2010.
Healthy vegetation cover-
age is one of the best practices
to maintain the stability of the
engineered slopes (Miller, 2012).
In the Mississippi levees, grasses
are cultivated in order to keep
the surface protected from ero-
sion. The type of grass varies
according to the season and
geographic location. The most
Figure 1. Localization of the study area with an oblique perspective of the levee (middle and right
images). The black areas on the right image are the study areas of interest (AOIs).
T
able
1. R
iverside
A
rea
of
I
nterest
(AOI) D
etails
AOI
#
Latitude
(at Center)
Longitude
(at Center)
Width
(m)
Length
(m)
1 32° 36' 28.8" N 90° 59' 49.2" W 18.3
159
2 32° 36' 32.4" N 90° 59' 45.6" W 9.0
63.2
3 32° 36' 32.4" N 90° 59' 49.2" W 9.1
51
4
32° 36' 36" N 90° 59' 45.6" W 9.9
97.6
510
July 2016
PHOTOGRAMMETRIC ENGINEERING & REMOTE SENSING


