C, and D are on the mentioned curve, the intensity registered
by the sensor in E is related to D, which means that the points
A, B, and C are occluded in the base image (A similar effect is
known as Z-buffering in computer graphics (Greene, 1993)).
After projecting the
DSM
pixels to the image space, it has to be
specified that the intensity of E is originating from D. To solve
this issue, we used the associated elevations as follows.
Here,
DSM
is considered as a 2D matrix in which every
entry represents the orthogonal projection of a point on the
ground. Thus, the point B does not exist in the
DSM
and is not
projected to the image spaces. Accordingly, point B, and other
vertical features, do not generate any rows in the
LUT
and are
automatically removed from the change detection process.
However, the points A, C, and D, are all projected to E and
the intensity of E originates from the point with the highest
elevation, since in satellite images, the higher elevated points
tend to occlude the lower elevated ones. Thus, since E has
multiple projections, we can compare the elevations of the
projected points (A, C, and D) and match E to the
DSM
pixel
which has the highest elevation (point D). Therefore, with an
elevation comparison, the occluded pixels are detected and
removed from the
LUT
. This means even if the points A, B, and
C are visible in the target image (points a, b, and c in Figure 4),
they are removed from the change detection process since they
are occluded in the base image or belong to a vertical surface.
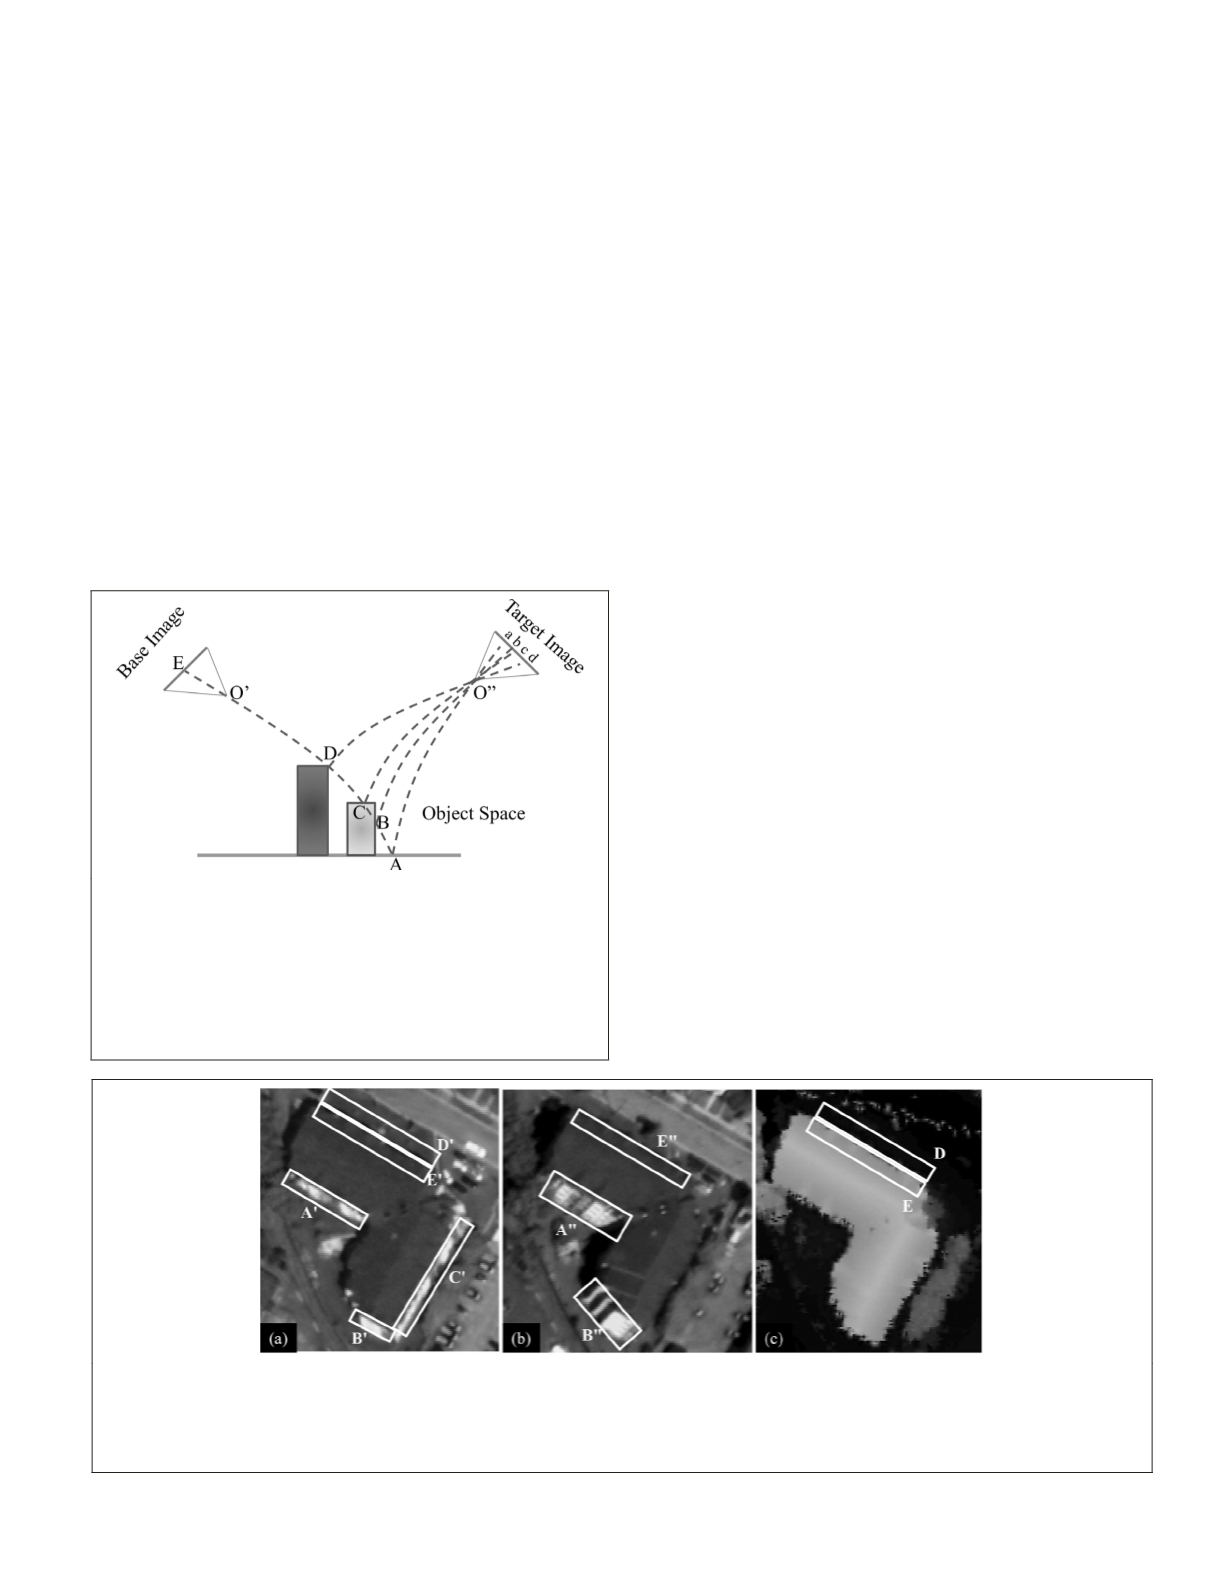
Figure 5 represents a real example of occlusion caused by a
building in two off-nadir bi-temporal images (Figure 5a is the
base image, and Figure 5b is the target image) and associated
DSM
(Figure 5c). As explained earlier, the vertical surfaces
(area A', B', and C'
in Figure 5a and area A" and B" in Figure
5b) do not exist in the 2D
DSM
, and accordingly do not get any
projections in the image spaces; thus, the associated pixels
are automatically removed from the change detection process.
Area D exists in the
DSM
, Figure 5c, and is visible in the base
image, Figure 5a, but this area is occluded in the target image,
Figure 5b, by area E" (E" is a part of the roof). Thus, the pixels
of area D and E in the
DSM
will overlap once projected to the
target image space. This causes the pixels of area E"
to have
double projections. Therefore
,
by comparing the elevations
of the projected pixels, the roof pixels (with higher elevation)
will be kept and pixels of Area D, and accordingly area D',
will be removed from the change detection process.
This process is applied on the
LUT
generated in S
tep 1.
If
any image pixel gets multiple projections, the related eleva-
tions of the
DSM
pixels are compared to remove the rows as-
sociated with the occluded pixels from the process.
Step 3: Generation of Corresponding Patches
After generating the
LUT
and purifying it from the occluded
areas, the patches corresponding to those in the base image
are generated in the target image. To do so, from the
LUT
,
[
x
1
,
y
1
,
x
2
,
y
2
,
X
,
Y
,
Z
,
S
k
]
j
, the part [
x
2
,
y
2
,
S
k
]
j
is selected. Therefore,
there exists a unique patch
ID
(inherited from the base image
segmentation) for the not occluded target image pixels. Re-
gardless of occlusion, transformation of the patch
ID
from the
base image to the target image can also be rewritten as:
S
x
y
x
y
S
k
k
1
1
1
=
∈
{
|
}
(5)
S T G
X
Y
Z
TG
X
Y
Z
S
k
j
j
k
2
1
2 2
1 1
=
∈
{
(
)| (
)
} .
(6)
Hence, the corresponding patches are regenerated in the
target image (a vector polygon layer is generated) based on
the patch
ID
s (
S
k
). Since the patch
ID
s are common between
the target and the base image, the corresponding patches in
the bi-temporal images are related. We also call this process
Figure 5. A real example of the occlusion effect in VHR imagery. The areas bordered by rectangle A′ and B′ belong to the building façade
in (a) Due to higher off-nadir view angle in (b), more the building façade is visible in areas bordered by A′′ and B′′. These areas that belong
to vertical surfaces are removed from the change detection process since they do not exist in a 2D DSM. Area C′ also belongs to a verti-
cal object and is removed from the change detection process; Area D in (c) is occluded by the building roof in (b) and is removed from the
change detection process by elevation comparison.
Figure 4. Schematic representation of the occlusion effect in VHR
imagery and occlusion removal by PWCR. Using RFM, the points
A, C, and D are all projected to the point E on the base image.
However, the intensity of the point E is only related to the point D,
because D has a higher elevation and C and A are occluded (The
line AE is shown as a curved line to reflect that the RFM equa-
tions are not linear). On the other hand, all the points A, B, C and
D are visible in the target image (a, b, c, d). Therefore, A, B, and C
are removed from the change detection process.
PHOTOGRAMMETRIC ENGINEERING & REMOTE SENSING
July 2016
525


