TPR
tp
tp fn
=
+
(9)
FPR
fp
fp tn
=
+
.
(10)
Figure 12 presents the
ROC
curves generated using the two
mentioned change criterion for each of the four datasets.
The closer the
ROC
curve of a criterion to the point (0, 1)
the better the criterion in identifying changed patches from
unchanged ones. If the
ROC
curve of a criterion is close to
diagonal (line identified by
TPR
=
FPR
), that parameter is not
suitable for identification of changed from unchanged patch-
es. To quantify the comparison of the
ROC
curves, a parameter
called Area Under the Curve (
AUC
) is used (Fawcett, 2006).
Figure 13 shows the bar charts of the
AUC
s of the change
criteria used in this study, for the datasets DT1 to DT4. Since
the
AUC
generated for these datasets are based on a number of
check samples and not the whole dataset, the 95 percent con-
fidence intervals are calculated and shown by a vertical black
line on the bar charts of the Figure 13.
As can be seen in Figure 13, the Image Differencing
method and
MAD
Transform both have high
AUC
values which
show high accuracy in discriminating changed segments from
unchanged ones.
Discussion
PWCR Discussion
As can be seen from Plate 1, regardless of the different relief
displacement directions of the buildings in the images or the
structure of urban area, the
PWCR
has been able to generate
properly fitting roof borders in the target images. The different
off-nadir angles of the images in the bi-temporal datasets did
not affect the
PWCR
accuracy.
As presented in Figure 10, the Area Ratios generated by the
PWCR
method (black bullets) are more consistent and closer
to one than the Area Ratios generated by the conventional
method (white bullets). The
PWCR
Area Ratios mainly range
from 0.8 to 0.95. This shows
PWCR
produces corresponding
segments that closely fit the actual object borders in target im-
ages. Conversely, the Area Ratios of the conventional method
are lower than the results of
PWCR
, by roughly 40 percent,
and also are highly variable (ranging from 0.05 to 0.9). This
is because the
PWCR
method accounts for the relief displace-
ment caused by high off-nadir angles by using the orientation
parameters (
RPCs
) of the images. However, this issue is not
solved in the conventional method; in fact, the higher the
elevation of the buildings, the higher the relief displacement.
This leads to high divergence between the object borders gen-
erated using the conventional co-registration and the actual
object borders in the target image, which results in lower Area
Ratio values. The variance of the conventional method Area
Ratios is due to elevation differences of the test objects.
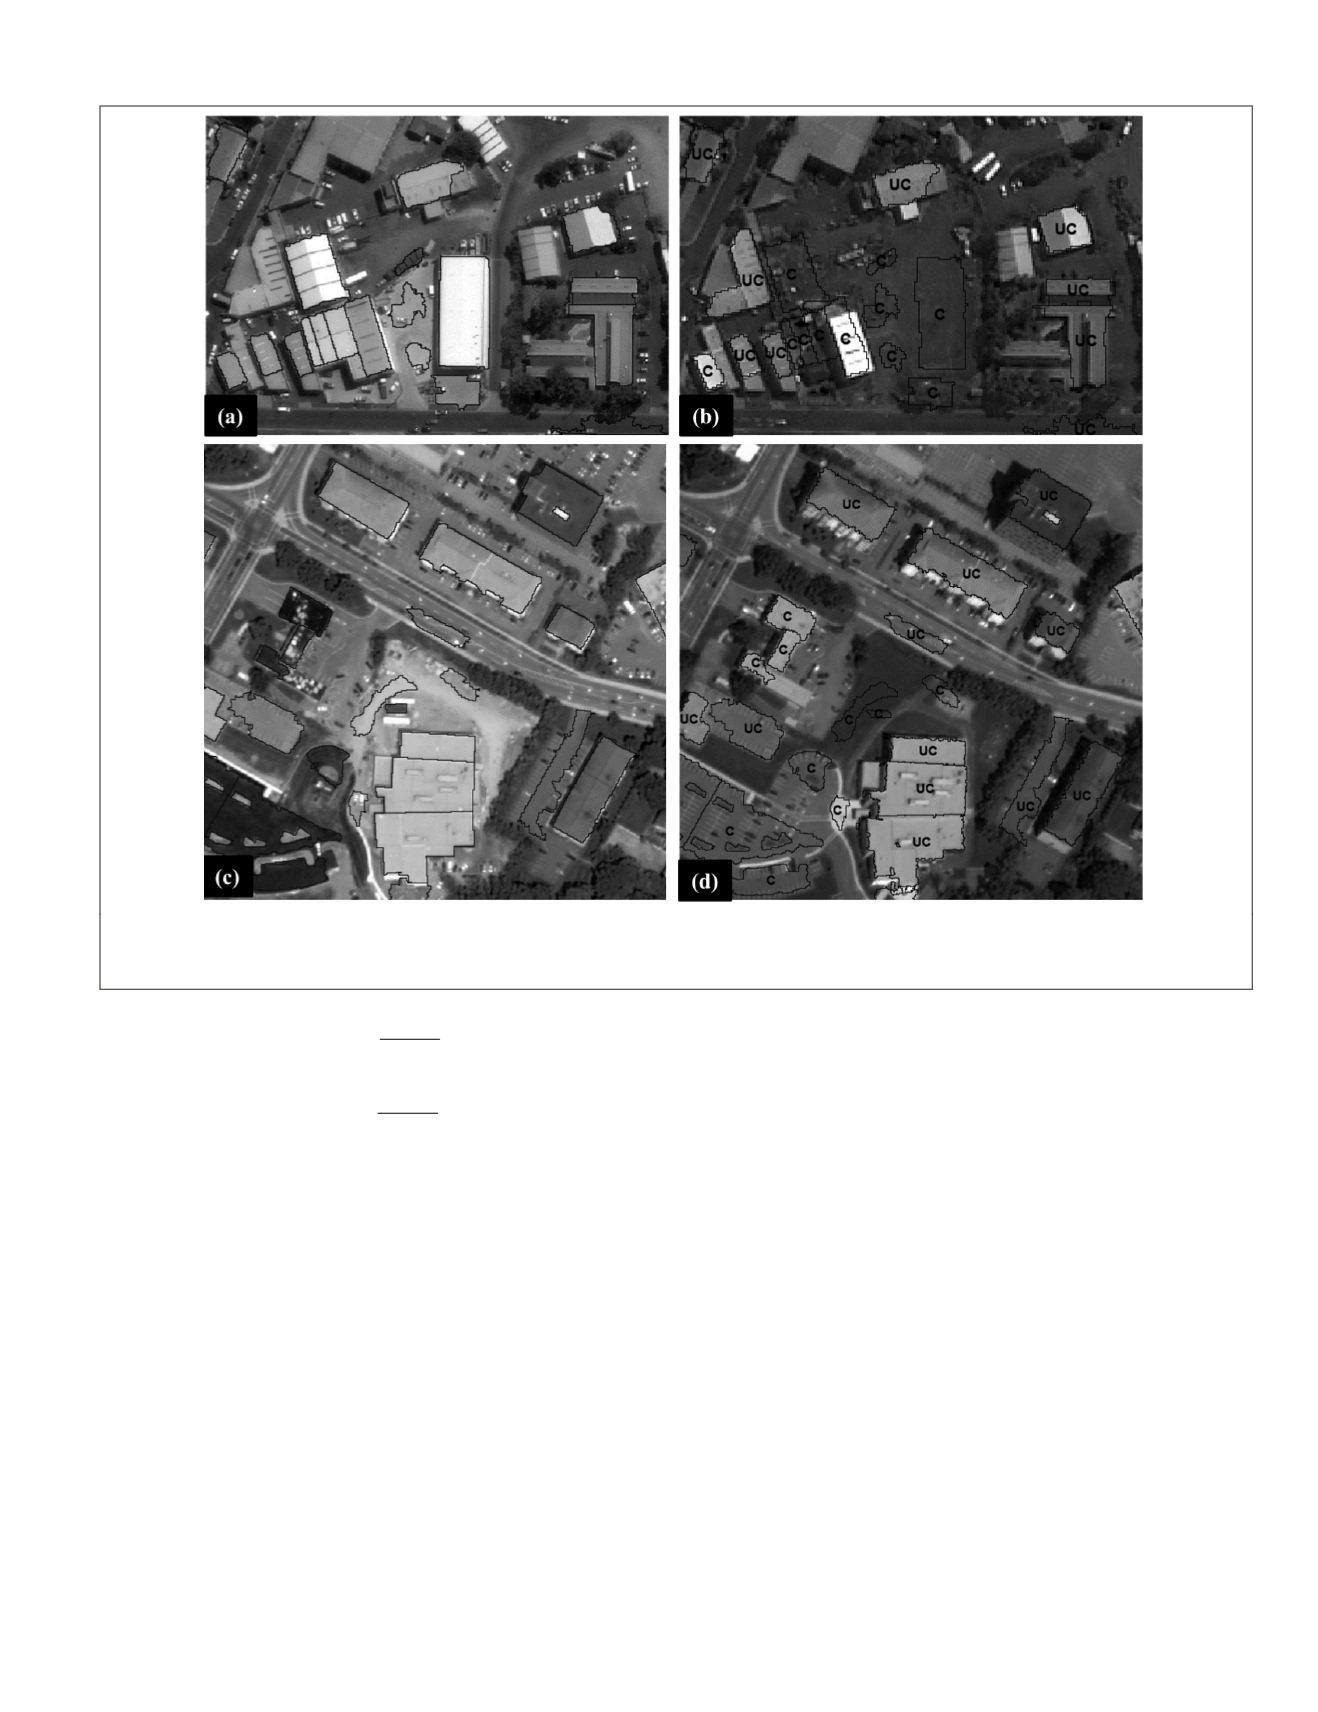
Figure 11. Samples of the reference patches selected for change detection accuracy assessment from datasets DT2 ((a) and (b)) and
DT4 ((c) and (d)); (a) and (c) depict base image patches, while (b) and (d) show the corresponding target image patches generated by
PWCR along with labels discriminating the status of the objects (UC: unchanged; and C: changed).
PHOTOGRAMMETRIC ENGINEERING & REMOTE SENSING
July 2016
531


