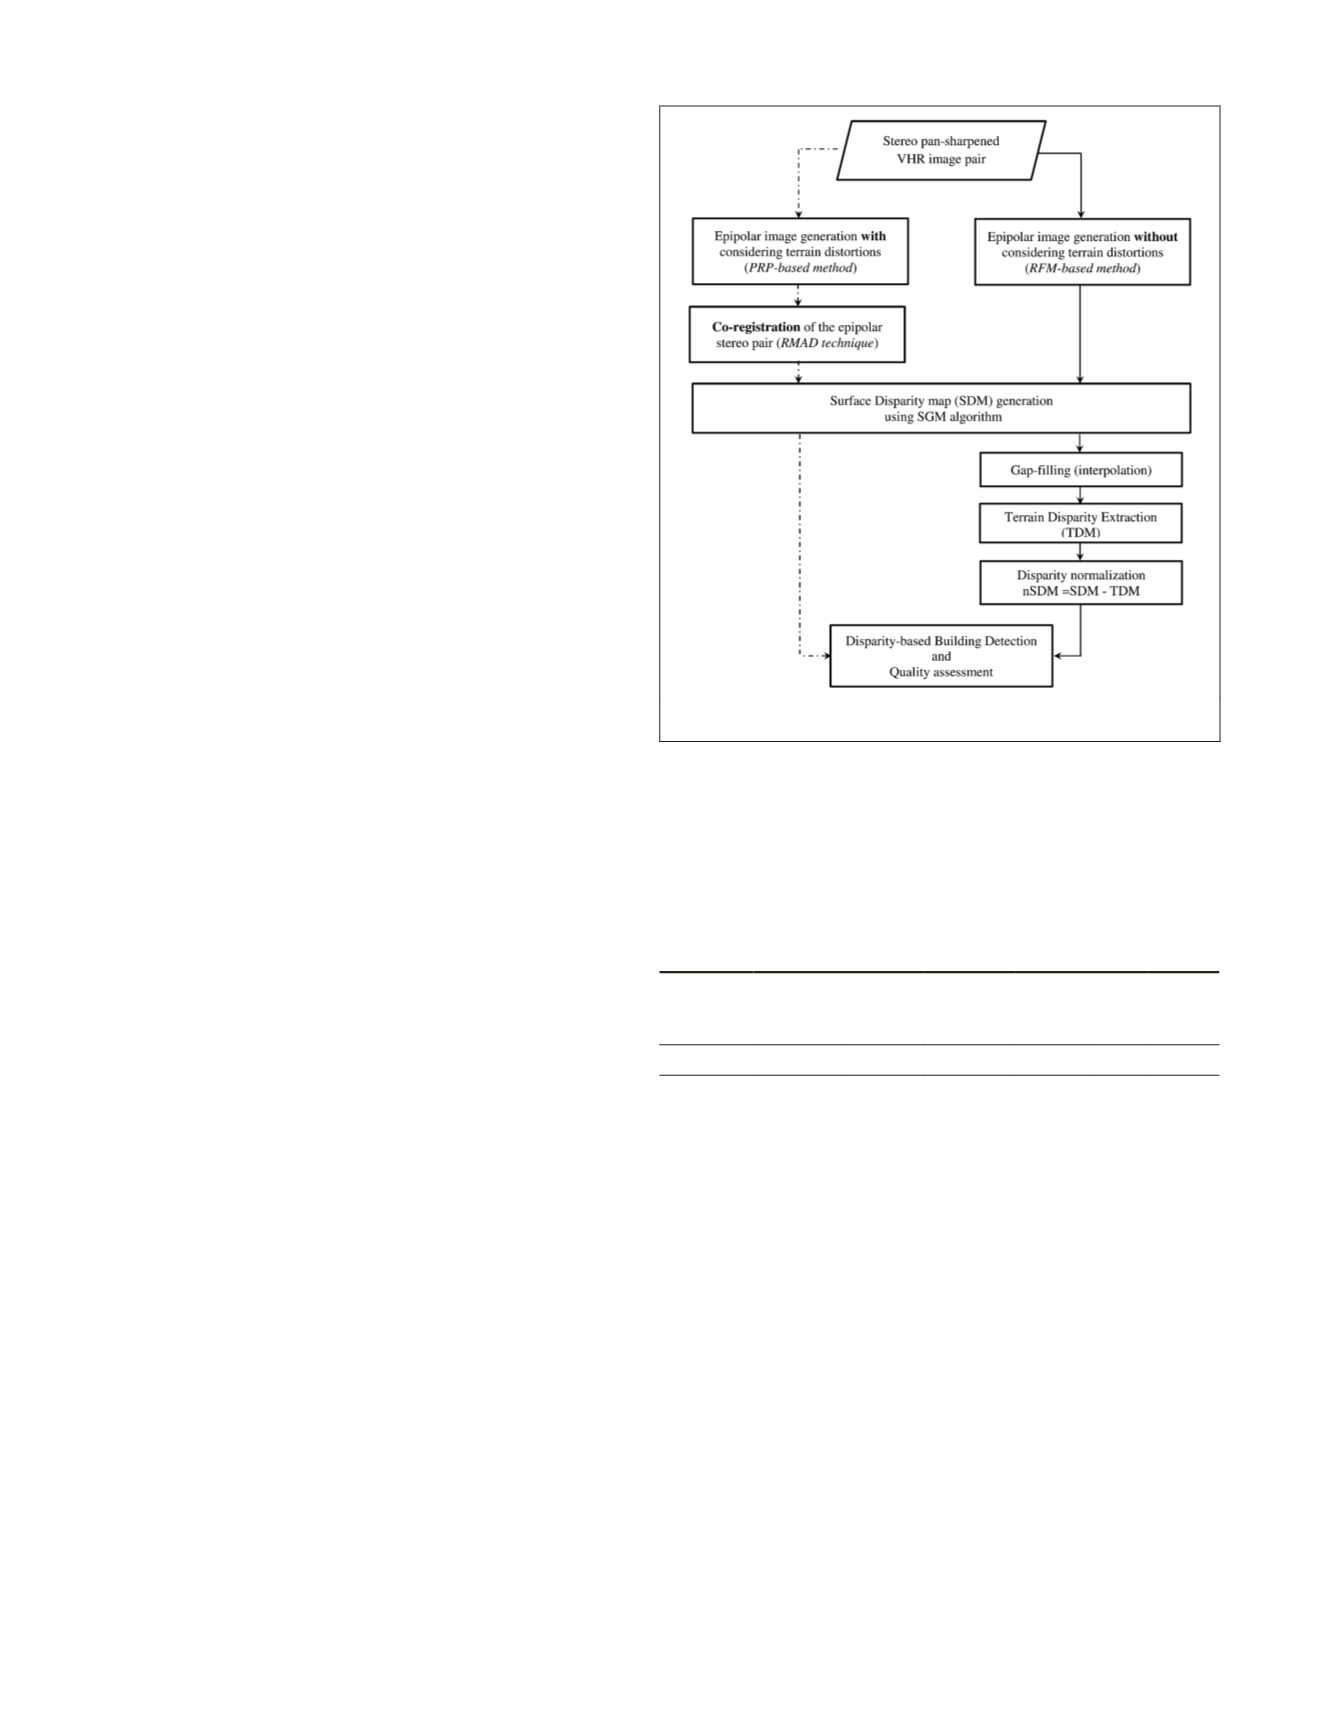
and compares them against the developed
RMAD
technique for
the disparity-based building detection (in dashed lines).
Experimental Results
Dataset and Study Area
The optical data used in this work are a subset of stereo
VHR
images acquired by a linear sensor with push-broom scanning
mode. These stereo images were taken by Pleiades-1A satellite
over the urban area of Melbourne, Australia (2012). The two
opposite acquisition angles of the forward and backward off-
nadir images are approximately +15 and −15 degrees, respec-
tively. The product’s ground resolutions are 0.5 m/pixel for the
panchromatic and 2 m/pixel for the four multispectral bands.
This test area was selected specifically to represent a dense
urban environment with a variety of building shapes, sizes, and
heights. The study area spans about 1.5 km by 0.8 km and con-
tains 170 buildings, 15 of which are high-rise buildings. About
76 percent of the scene is pixels belonging to buildings (46 per-
cent of the scene is rooftops and 30 percent is building façades)
while the rest represent vegetation and traffic areas. A reference
dataset for building rooftops in the scene was manually pro-
duced based on expert’s interpretation of the satellite image.
Results of the Developed RMAD Technique
The steps in the developed
RMAD
technique were implement-
ed and applied as detailed in the Methodology Section on
the study area. The derived results, including co-registration,
disparity map generation, and the detected buildings are
evaluated in the following sections.
Results of Co-registration and Disparity Map Generation
In this step, the right image of the epipolar pair was co-regis-
tered to the left one by applying a 2D translation calculated
from a set of ground-level points. In our implementation, four
points defined by intersection of road centers were identified
and used. The details of these points and the result of co-reg-
istering the stereo epipolar pair are all illustrated in Figure 7.
The final step in the developed
RMAD
technique was gen-
erating the disparity map (Figure 8) by performing the
SGM
algorithm. The disparity map was an exact fit to the reference
epipolar image (i.e., the left image). It is noticeable that the
straight-line roads have a disparity of almost zero value (black
pixels between building edges in Figure 8b). This is due to
the success in the co-registration of the terrain roads in both
stereo epipolar images. The measured non-zero disparity
values represent almost all the off-terrain objects including
buildings and trees.
Results of Building Detection Based on
RMAD
Technique
The building detection algorithm developed in the Methodol-
ogy Section was applied to the study area. The
VHR
epipolar
imagery was over-segmented using a small scale (
≈
60). After
calculating the vegetation index (
NDVI
), all trees were removed
from the detection result using a threshold value close to 0.2, as
recommended by many researchers (Suliman and Zhang, 2015).
Then, all off-terrain building segments were detected based on
the positive disparity values (i.e., >zero). Finally, building seg-
ments were merged together, and the segments of small areas
were filtered out based on empirically selected threshold value.
Figure 9 provides the disparity map, the detected building
roofs, and the reference data for visual assessment of the quality
of the proposed building detection framework. Comparing the
detection result (Figure 9b) and the reference data (Figure 9c),
it can be seen that almost all building roofs have been correctly
detected. Furthermore, the shape and size of the most building
roofs are almost the same as those in the reference data.
The three accuracy measures, as described in the Valida-
tion Procedure Section, are calculated for evaluating the detec-
tion performance of the proposed
RMAD
technique (Table 1). It
can be seen from Table 1 that three-fourth of the building roofs
in the reference data are detected. The detection is accurate
by almost 100 percent. This reliable detection is attributed to
the precise disparity information used which led to overall
detection quality of 75 percent. This quality is highly accept-
able considering that the employed images suffer from a lot of
occluded areas and that no other images or data were used.
T
able
1. E
valuation
M
easures
for
B
uilding
D
etection
U
sing
RMAD T
echnique
Evaluation
measures
True
Positive
(pixels)
False
Positive
(pixels)
False
Negative
(pixels)
Comp.
(%)
Corr.
(%)
Overall
Quality
(%)
Values
1033731 16494 328195
74 98
75
Results of Comparing Conventional Techniques
Results of Disparity Map Generation and Normalization using Conventional
Techniques
The approach developed by Zhang
et al.
(2004) represents an
alternative approach to the co-registration step of the
RMAD
technique. Their technique applies an interpolation step to
fill the occluded areas and gaps in the surface representation,
followed by extracting the underlying surface using a local
minima algorithm. This extraction algorithm and the interpo-
lation were applied to the generation of a disparity map using
the same dataset. The critical input value required by this
algorithm is the size of the moving window. A constant win-
dow size bigger than the largest building roof in the scene was
selected based on the approach developers’ recommendation
and a few trial implementations of our test. The results of the
individual steps of this technique are illustrated in Figure 10.
Figure 10 shows that the filled gaps by interpolating the
surrounding data lead to misleading information that destroy
the quality of the generated disparity maps. This inaccurate
information affects the normalization process negatively
when the extracted terrain information is subtracted from the
interpolated disparity map. This negative effect will reduce
directly the accuracy of the building detection.
Figure 6. The work flow for building detection using RMAD-based
(dashed line) versus RFM-based (continuous line) disparity map.
540
July 2016
PHOTOGRAMMETRIC ENGINEERING & REMOTE SENSING


