technique) is used, most of the
adjacent buildings are merged
and the narrow streets are missed
(Figure 13b). This is attributed
to the effects of gaps-filling by
interpolation in crowded dense
urban area.
The
RMAD
technique nor-
malizes the disparity informa-
tion through co-registering the
ground-level features in both
epipolar stereo images. The
result, shown in Figure 7, is of
acceptable quality based on the
visual assessment of the straight-
line streets. The main factor for
this successful registration is the
minimization of the reasonable
terrain variation by the image
rectification step using the aver-
age terrain variation. This rectifi-
cation eliminated almost all the
disparity of ground-level features
as shown by the black pixels
(zero-disparity) in the main and
narrow streets in the study area
(Figure 8 and Figure 13a). The
disparity map generated in this
figure represented almost all the
aboveground objects.
On the other hand, the dispar-
ity map generated based on the
RFM
-based epipolarity technique
needed to be normalized. The
RFM
-based technique does not
rectify or minimize terrain relief
distortion, the outcome of which
caused terrain features to have
disparity variation. Additionally,
the need to fill the gaps by interpolation resulted in further
deterioration of the generated surface disparity in dense urban
areas (
SDM
in Figure 10b). Continuing with the approach by
Zhao
et al.
(2008), the
TDM
was extracted by the local-minima
technique (Figure 10c) which contributed to creating mis-
leading information when subtracted from the interpolated
SDM
. The compound negative effects of the interpolation and
local-minima filtering caused the omission of some buildings’
disparity in the obtained
nSDM
(Figure 10d).
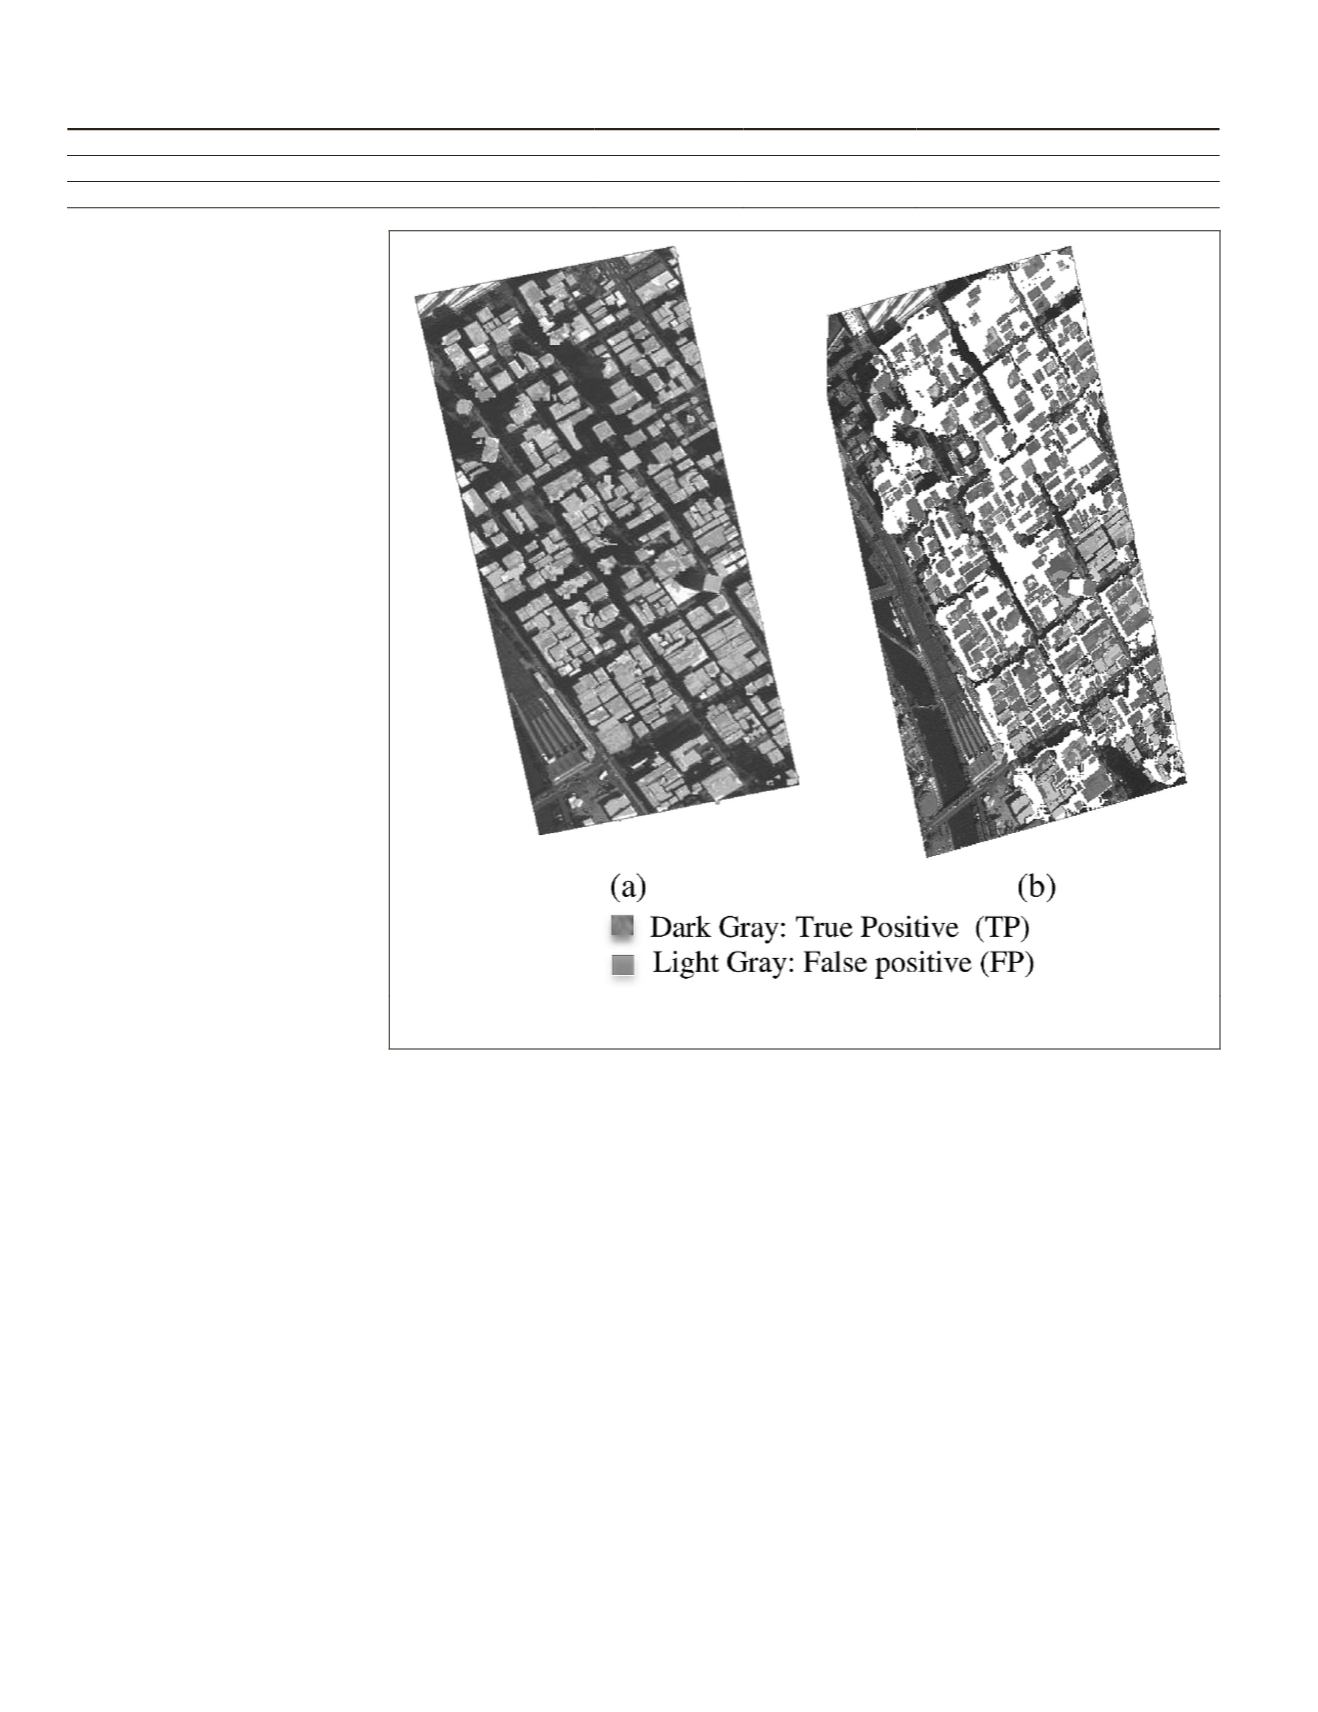
Comparison of the Different Building Detection Results
For the ease of comparison, Figure 14 illustrates the results of
the detected buildings using disparity information achieved
based on both the developed
RMAD
technique and the con-
ventional local-minima-based normalisation technique. In
the figure, the true positive and the false positive results are
represented in dark and light gray, respectively.
By visual inspection of the detection results in Figure 14,
one can see the huge improvement in
RMAD
-based result rela-
tive to that achieved by the conventional technique. While the
detected roofs in Figure 14a are clearly separated from each
other, these building roofs in Figure 14b are merged together
along with the narrow streets between. The quantitative
analysis of these building detection results with the reference
to the evaluation measures (Correctness, Completeness, and
Overall Quality) are compiled from Table 1 and Table 2 and
listed in Table 3.
From the correctness measures listed in Table 3, it is clear
that
RMAD
-based procedure was able to provide correct detec-
tion of almost 100 percent. This is due to the reliable key
feature used for the detection, which is the generated dispar-
ity information. It is worth mentioning that the detection was
achieved by thresholding the generated disparity map by an
almost zero-value. This further proves that the performed
co-registration of the epipolar stereo images properly approxi-
mated the aboveground disparity map (i.e.,
nSDM
). On the
other hand, the conventional normalization technique pro-
duces a low correctness value of 48 percent which indicates
that the techniques for epipolar generation and disparity map
normalization are inefficient in detecting building’s rooftops.
The main reason for that is the misleading information result-
ing from the interpolation step to fill the gaps in dense urban
areas. This incorrect information deteriorated the quality of
the generated surface disparity map and, thereafter, the subse-
quent steps.
Regarding the completeness measures provided in Table
3, about 25 percent of the building roofs in the scene were
missed in the
RMAD
-based detection result. However, visual
Figure 14. Comparison between the results of disparity-based building detection using (a) RMAD
technique, and (b) the normalized disparity map achieved by local-minima-based technique.
T
able
3. C
omparison
of
A
ccuracy
M
easures
for
B
uilding
D
etection
R
esults
A
chieved
by
RMAD T
echnique
and
C
onventional
N
ormalization
T
echnique
Building detection results based on
Corr. (%)
Comp. (%)
Overall Quality (%)
RMAD Technique
98
74
75
Conventional Technique
48
82
43
544
July 2016
PHOTOGRAMMETRIC ENGINEERING & REMOTE SENSING


