The objects that result are run through a classification
routine which assigns one of five classes - bare earth, shadow,
vegetation, paved road and unpaved road - to each object. An
eCognition rule set (Figure 3) classifies the resulting objects
from the segmentation portion of the algorithm. This classifi-
cation process uses a decision tree classifier, where a binary
decision is made based upon the data values within each ob-
ject. The first step in the classification process is to determine
whether the object is vegetation by calculating the normalized
difference vegetation index (
NDVI
) for the object. Through
random and manual examination of known vegetation poly-
gons and their
NDVI
values, a threshold
NDVI
value (0.065)
was determined. If the calculated
NDVI
value was greater than
0.065, the polygon was classified as vegetation. If the polygon
is not classified as vegetation it is passed on to the next step
in the algorithm. This process is repeated for bare earth (the
value must be greater than or equal to 0.8) and shadow (>=
130) classes. Road polygons that get this far are evaluated for
a value of IR-Blue value of >=0 and an IR-Green value of >=6;
these values are calculated before classification and stored
as a layer of data for processing in eCognition. Polygons that
meet those criteria are classified as unpaved. The polygons
that are classified as unpaved are then merged and exported
as a shapefile for further processing in ArcGIS (Figure 4).
The classification procedures for determining object clas-
sification as bare earth and shadow builds from the work of
Nobrega
et al
. (2008). As areas of both unpaved and paved
roads appeared as spectrally similar shadowed areas (i.e., the
road type within the shadow cannot be defined as unpaved or
paved), it was necessary to treat this as a class for the purpos-
es of the classification of road types, although shadow is not
technically a cover type. Initial analysis of band relationships
showed a strong correlation
between positive values in the
infrared minus green (IR-Green)
calculation to the presence of an
unpaved road. This relationship
was tested using a receiver oper-
ating characteristic (
ROC
) curve,
a graphical plot that depicts the
performance of a binary classi-
fier, in our case whether a road is
paved or unpaved. An
ROC
curve
is commonly used in signal
detection (Hand, 2001); however
its methods can be applied here
when selecting values for algo-
rithm components, such as the
IR-Green value.
The
ROC
curve was calculated
on the IR-Green parameter to
find the optimal threshold for
differentiating unpaved from
paved roads by finding the value
that best detects unpaved roads.
The
ROC
curve displays the frac-
tion of true positives (
TP
) out of
all positive results (probability
of detection; ρd) plotted against
the fraction of false positives
(
FP
) out of all negative results
(probability of false alarm; ρfa)
for any IR-Green value for detect-
ing unpaved roads (versus paved
roads). Plotting an
ROC
curve en-
ables users to find the best value
for the IR-Green parameter by
selecting a value that maximizes
the number of true positives
while minimizing false positives.
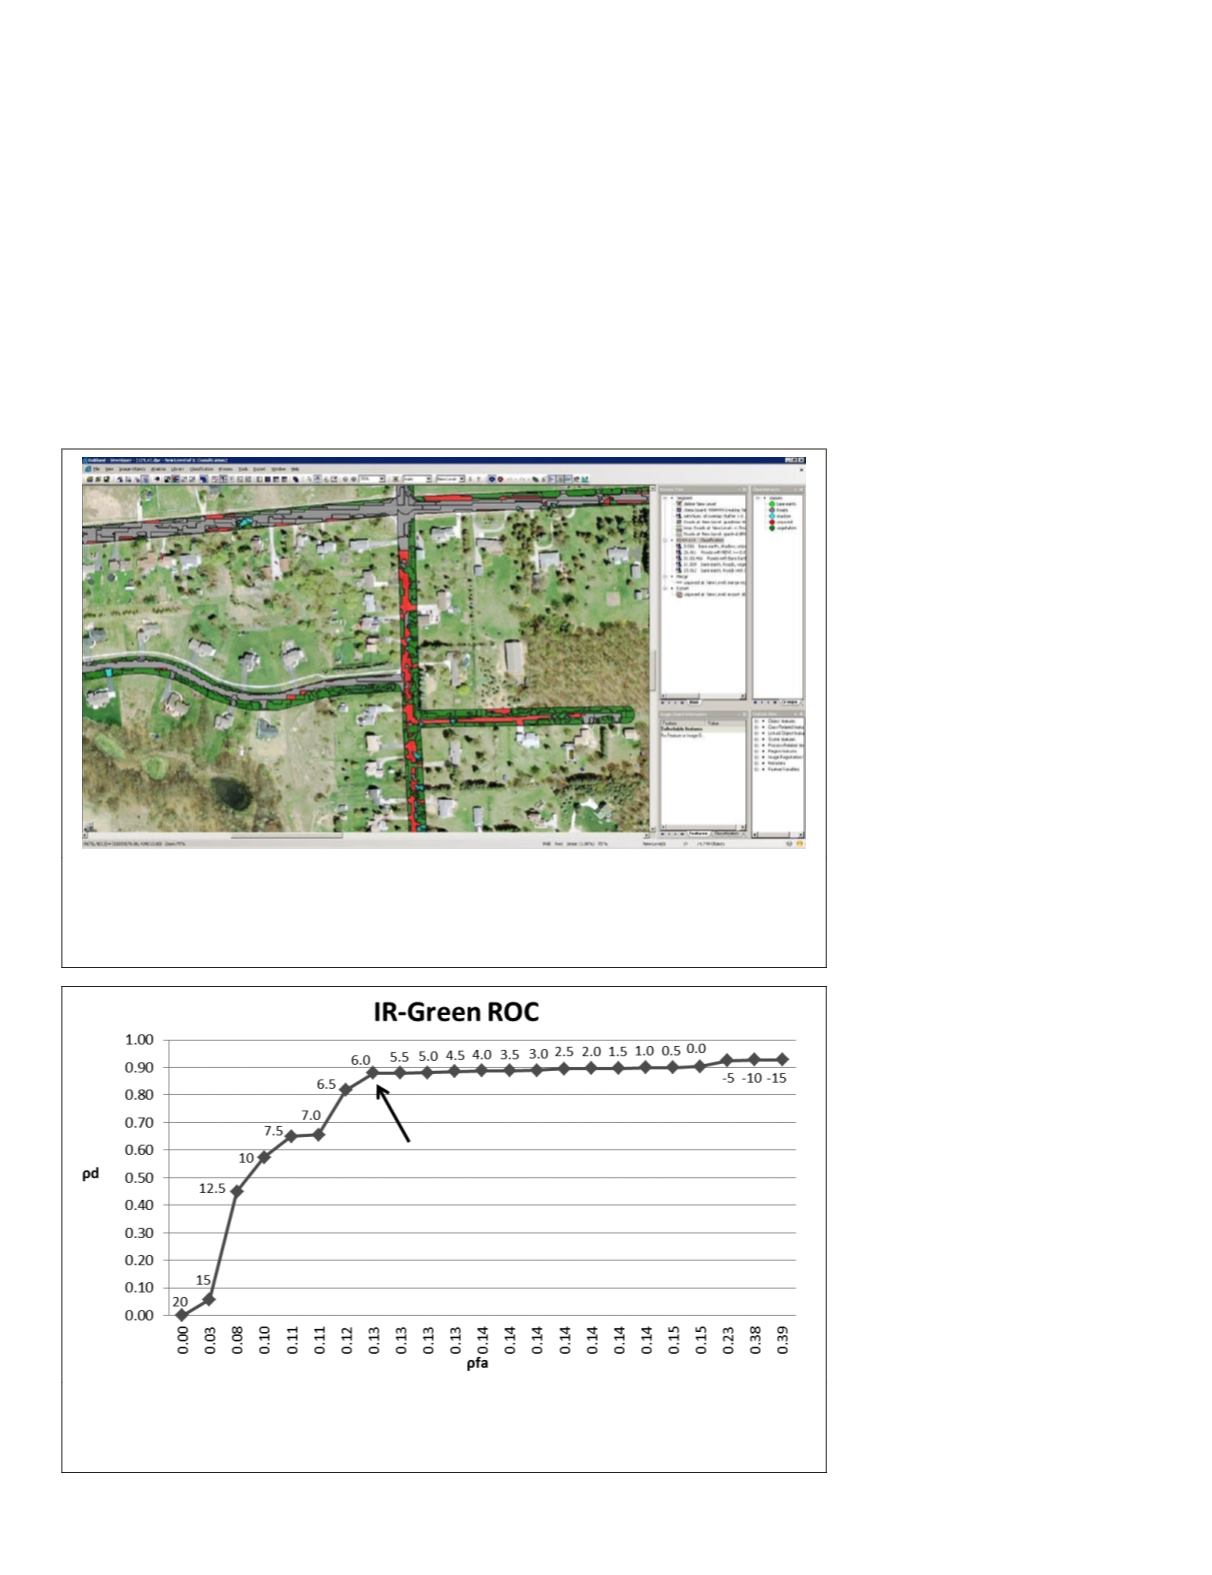
ROC
curve analysis revealed that
an IR-Green value of 6 (arrow,
Figure 5) with a ρd of 0.88 and a
ρfa of 0.13 returns the best results
(Figure 5). However, IR-Green
values of between 0 and 6 will
yield similar results where the
ROC
curve is flat. After segmen-
tation in eCognition, objects
classified as unpaved are merged
into a single object and exported
as a shapefile for further analysis
in ESRI ArcGIS (versions 10.0
Figure 4. A representation of the RGB bands of the four-band aerial image from Oakland
County MI (Figure 1) loaded into eCognition and classified using rule sets for segmenta-
tion and classification described in Figure 3. Gray polygons have been classified as paved
road, green polygons are classified as vegetation, cyan polygons are classified as shadow
and red polygons are classified as unpaved road.
Figure 5. Receiver Operating Characteristic curve plot for the IR-Green parameter (pd -
probability of detection; pfa - probability of false alarm). Points on the curve are labeled
with their corresponding IR-Green value. The arrow points at the ‘knee’ in the curve that
is the value that maximizes the true positive results while minimizing false positives.
380
May 2017
PHOTOGRAMMETRIC ENGINEERING & REMOTE SENSING


