The 4th Annual ASPRS SAC GeoLeague Challenge
To be held at the 2014 Annual Conference in Louisville KY USA March 23-27 2014
GeoLeague Challenge
This will mark the fourth year of the GeoLeague Challenge to be held at the ASPRS Annual Conference in March 2014. Teams from across the country compete to solve the challenge put forth by the ASPRS Student Advisory Council (SAC). Please review the challenge and the rules for 2014. The topic for 2014 is Mapping Ecosystem Services Change in Coastal Belize Based on Landsat Data. This year we are working in cooperation with the Natural Capital Project in an effort to assist them with a study for ecosystem services mapping in the coastal zone of Belize.
Mapping Ecosystem Services Change in Coastal Belize Based on Landsat Data
Background
In the past two decades people have gradually begun to accept that ecosystem services are important to the functioning of the Earth’s life-support system. Ecosystem services contribute to human welfare and therefore represent part of the total economic value of the planet (Costanza et al. 1997). From the Millennium Ecosystem Assessment (2005) some of these services include: supporting services (nutrient cycling soil formation primary production); provisioning services (food fresh water wood and fiber fuel); regulating services (climate food disease water purification); and cultural services (aesthetic spiritual educational recreational). Mapping and modeling ecosystem services can help uncover hidden costs and benefits of different natural resource management options. This leads to providing key information to improve the relationship between humans and the ecosystems.
The Natural Capital Project (NatCap http://www.naturalcapitalproject.org) is a joint venture among Stanford University the University of Minnesota The Nature Conservancy and World Wildlife Fund. NatCap aims to integrate the values of nature into all major decisions affecting the environment and human well-being. InVEST (Integrated Valuation of Ecosystem Services and Tradeoffs) is decision-support tool developed by the Natural Capital Project that allows nature’s benefits to be incorporated into decision-making. InVEST models have been used in over a dozen significant policy applications worldwide—from the designation of ecosystem function conservation areas in China to the establishment of water funds in Latin America to marine spatial planning in Belize (Ruckelshaus et al. 2013 Guerry et al. 2011). These tools and models are available for use and further research. By integrating spatially explicit information on biophysical social and economic values a more holistic approach to studying and analyzing ecosystems is possible.
Since 1972 Landsat satellites have continuously acquired images of the Earth’s land surface coastal shallows and coral reefs. Landsat represents the world’s longest continuously acquired collection of space-based moderate-resolution land remote sensing data. The data are used by government commercial industrial civilian military and educational communities throughout the United States and worldwide. The data support a wide range of applications in such areas as global change research agriculture forestry geology resource management geography mapping water quality and coastal studies (See the Landsat Project Factsheet for more details: http://pubs.usgs.gov/fs/2012/3072/fs2012-3072.pdf). The 2014 SAC GeoLeague Challenge is focused on using Landsat imagery and other ancillary data (DEM and GIS data) for ecosystem services mapping in the coastal zone of Belize. This Challenge will go a long way towards helping policymakers improve human well-being by motivating greater and more cost-effective investments in both.
Challenge Scope & Objectives
Students are required to explore the services mentioned in the background material above. Suggestions include:
1. Supporting Service of primary production;
2. Provisioning Services (food fresh water wood and fiber and fuel);
3. Regulating Services such as those for climate (e.g. carbon sequestration) water purification (varies with ecosystem change and location) and natural hazard regulation (loss of natural buffers such as riparian areas wetlands and mangrove);
4. Cultural Services including aesthetics (decline in quality and quantity of natural lands) and recreation and tourism (more accessible areas may be degraded).
Each project team will map measure and value one of the above services by performing the following steps:
1. Explore Landsat imagery archive and other ancillary data using commercial or open-source tools to map ecosystems and people in the Belize’s coastal zone (3km inland) and marine territorial sea. Depending upon the service chosen each team will need to map one or more of the following:
• Sea grasses in 1980 and 2010
• Coral reefs in 1980 and 2010
• Residential development in 1980 and 2010. The location of people is important for mapping beneficiaries and the resulting demand for ecosystem services.
Note: a mangrove/littoral forest survey for 1980-2010 will be provided along with Landsat surveys of coral reefs in 1997 and sea grasses in 1997 and 2007.
2. Undertake a change analysis (post-classification) in order to determine any difference in ecosystem service supply and demand between 1980 and 2010.
3. Map change for one service and the resulting change in economic value to people. Teams should determine the appropriate service that can be mapped based on available data.
4. Using results from the above steps:
• Highlight service tradeoffs that exist as a result of new zoning for human activities such as fishing shipping or coastal development within your study area.
• Offer suggestions to policymakers and stakeholders on ways to better manage Belize’s coasts and oceans in order to maximize economic opportunities and minimize environmental impacts.
Sample Workflow (modified from Troy & Wilson 2006)
Step 1: Defining project area
We allow each team to select the full-size or a subset of the provided study area. Please note that slight boundary changes can have huge impact on the final ecosystem services value estimation. Administrative boundaries may not correspond with biophysical boundaries. There should be a clearly stated reason why particular boundaries were selected.
Step 2: Data collection processing and error budgeting
Other than Landsat imagery each team will need to collect ancillary GIS data to support data acquisition and ecosystem service mapping. A literature review of economic studies should be conducted to determine the ecosystem service value coefficients for each land/ocean use type in the study. Economic valuation information can be extracted from peer-reviewed journals books technical reports and/or through meta-analysis.
Step 3: Mapping and calculating economic values
Derive final land/ocean use maps for 1980 and 2010. Calculate the ecosystem service value by referring to the economic valuation information determined in Step 2.
Step 4: Categorizing and detecting changes in the ecosystem services
Identify and calculate the land/ocean use change (1980 to 2010) and the resulting change in ecosystem service flows and values.
Step 5: Impact analysis of changes
Try to determine possible reasons for the detected changes in Step 4. Marks will be awarded based on following this structure or any other structure that clearly relates these five steps to create change detection report outlining the causes and effects of the changes in the ecosystem of the region of study.
Note: Relevant data coefficients maps etc. will become active in a few weeks at http://www.geointerest.frih.org/GL2014/
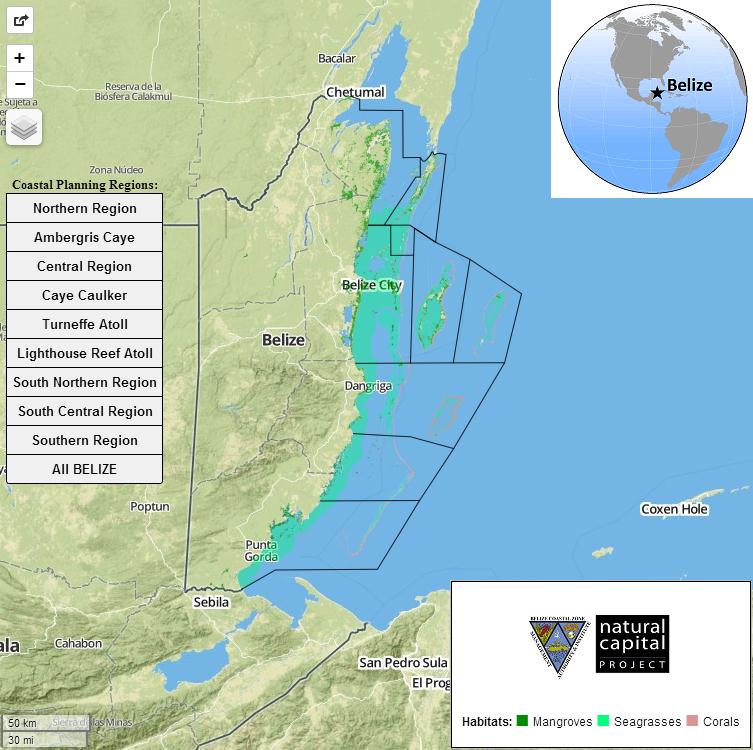
Figure 1: Project Area. Please note that only 3km of the coastal zone is part of this study area. The remaining land inward from the coast should not be included.
Potential Data Sources and References
• Belize ICZMP Data Portal: http://www.geointerest.frih.org/NatCap/
• USGS Earth Explorer: http://earthexplorer.usgs.gov/
• USGS LandsatLook Viewer: http://landsatlook.usgs.gov/
• The Natural Capital Project: http://www.naturalcapitalproject.org
• InVEST Ecosystem Service Models: http://www.naturalcapitalproject.org/toolbox.html
• InVEST User’s Guide: http://www.naturalcapitalproject.org/InVEST.html
• Clarke C. M. Canto S. Rosado. (2013). Belize Integrated Coastal Zone Management Plan. Coastal Zone Management Authority and Institute (CZMAI) Belize City. Accessed via http://www.coastalzonebelize.org/?page_id=681 August 2013.
• Clarke C. Rosado S. Rosenthal A. Arkema K. Canto M. Gillett I. Verutes G. Wood S. (2012) Coastal Zone Planning for Belize. The Natural Capital Project and World Wildlife Fund. Accessed via http://ncp-dev.stanford.edu/~dataportal/WWF_CZMAI_NatCap_Belize%20case%20study.pdf August 2013.
Participation Guidelines
Form a group of at least 5 undergraduate and/or graduate students and a faculty advisor in your region (at least 3 students must be ASPRS student members by the registration deadline and remain student members through the Annual Conference). If you have trouble meeting this requirement please feel free to contact us. You may also enlist the help of ASPRS members in your surrounding communities. However students must do all of the work. Those who are not students can only provide guidance.
To be eligible to compete please fill out a Registration Form and return it to
SAC Deputy Chair Mingshu Wang
mswang@uga.edu
prior to November 30 2013.
Proposal Deliverables and Deadlines
1) At least one representative from each team will be required to attend the 2014 Annual ASPRS Conference in Louisville to present the project. The team will be required to present two products: A scientific paper (following the guidelines presented by Photogrammetric Engineering & Remote Sensing for Highlight Articles online) describing in detail the solution to this year’s challenge including background on the project methods (algorithm development & mapping techniques) graphic illustrations and the team’s solution. The only exception to the Highlight Article guidelines is the word limit has changed from 2500 words to 4000 words. The 4000 word limit and formatting guidelines will be strictly enforced. Lack of adherence to these guidelines will result in the report not being evaluated.
2) A PowerPoint presentation where each team has 10 minutes to present at the ASPRS 2014 Annual Conference GeoLeague Challenge Session. Presentations will not be permitted to exceed 10 minutes.
All materials must be submitted by 8:00 pm EST on February 28th 2014.
Submission Requirements
Both the PowerPoint presentation and paper need to be uploaded to the ASPRS FTP site no later than 8:00 pm EST February 28 2014. No late submissions will be evaluated and no extensions will be given.
FTP Site: ftp://birdseye.asprs.org
Login: ASPRS/FTP_USER (all caps)
Password: ASPRSgeneral
Please place your materials in the GeoLeague folder with the name of your team in the heading (ex. teamname_paper.doc teamname_presentation.ppt).
Evaluation
The solutions will be evaluated both before and during the 2014 ASPRS Annual Conference by judges from different sectors of the geospatial industry (Government Employees Students Private Sector Employees Faculty etc.).
Importance relevance & applicability of solution to the stated objectives – 15 pts
This metric assesses whether the project report is responsive to the objectives and requirements stated in the Challenge. How does the solution address an important problem? (i.e. why is mapping ecosystem services change important?)
Creativity of solution – 10 pts
The creativity of the solution will be specifically addressed by these questions: Does the solution challenge an existing method(s) develop new methodologies or incorporate innovative technologies? If so what effect will the results have on concepts or methods that drive this field?
Technical/scientific merit – 30 pts
This metric assesses whether the approach is technically sound whether the methods are appropriate and whether there are clear project goals and objectives consistent with the Challenge objectives. Solutions should address the approach/soundness of design and judges will consider the following questions: Are the conceptual framework design methods and analyses adequately developed well integrated and appropriate to the aims of the project? Does the applicant acknowledge potential problem areas and consider alternative approaches? Is the workflow capable of being replicated in other areas on a larger scale? Does the solution indicate how the proposed methodology is an improvement over existing methods in terms of efficiency/cost or accuracy and timeliness? Does the solution help stakeholders make more informed decisions about how to use lands and waters?
Mapping/Visualization – 15 pts
Is the mapping framework comprehensive in considering all necessary factors including a well-organized and thorough plan visualization techniques to create appealing maps etc.? Do the cartographic elements of the map serve the function of the ecosystem services change mapping effectively accurately and efficiently?
Presentation Content – 20 pts
Does the PowerPoint presentation show the general process by which the methodology was created? Does the PowerPoint effectively convey why the team’s solution is the most effective and comprehensive? Is the PowerPoint presentation informative and understandable for a wide range of audiences? Does the presenter provide a compelling argument for why his/her team has the most thorough solution?
Project Report Format– 10 pts
Does the paper follow the PE&RS format guidelines for Highlight Articles? Are all project report format items addressed clearly and concisely?
Prizes
Recognition and a published Highlight Article in PE&RS one year complimentary membership in ASPRS for all first place team members $300 to the winning ASPRS student chapter gift certificates to the ASPRS Bookstore and many more prizes to be announced.
Contact
Please contact the ASPRS SAC Deputy Chair if you have any questions:
Mingshu Wang
ASPRS Student Advisory Council Deputy Chair
mswang@uga.edu
References
- Costanza R. R. d’Arge R. de Groot S. Farber M. Grasso B. Hannon K. Limburg S. Naeem R. V. O’Neill J. Paruelo R. G. Raskin P. Sutton & M. van den Belt (1997) The value of the world’s ecosystem services and natural capital. Nature 387 253-260.
- Millennium Ecosystem Assessment. (2005). Ecosystems and Human Well-Being: Synthesis. Island Press Washington. 155p Accessed July 31 2013 at http://www.millenniumassessment.org/documents/document.356.aspx.pdf
- Troy A & Wilson MA (2006) Mapping ecosystem services: practical challenges and opportunities in linking GIS and value transfer. Ecological economics 60(2):435-449.
Suggested Reading
- Bennett E. M. G. D. Peterson & L. J. Gordon (2009) Understanding relationships among multiple ecosystem services. Ecology Letters 12 1394-1404.
- Carpenter S. R. H. A. Mooney J. Agard D. Capistrano R. S. DeFries S. Díaz T. Dietz A. K. Duraiappah A. Oteng-Yeboah H. M. Pereira C. Perrings W. V. Reid J. Sarukhan R. J. Scholes & A. Whyte (2009) Science for managing ecosystem services: Beyond the Millennium Ecosystem Assessment. Proceedings of the National Academy of Sciences 106 1305-1312.
- Chastain R. A. & P. A. Townsend (2007) Use of Landsat ETM and topographic data to characterize evergreen understory communities in Appalachian deciduous forests. Photogrammetric engineering and remote sensing 73 563.de Groot R. S. R. Alkemade L. Braat L. Hein & L. Willemen (2010) Challenges in integrating the concept of ecosystem services and values in landscape planning management and decision making. Ecological Complexity 7 260-272.
- Fisher B. R. K. Turner & P. Morling (2009) Defining and classifying ecosystem services for decision making. Ecological Economics 68 643-653.
- Guerry A. D. et al. (2012). Modeling benefits from nature: using ecosystem services to inform coastal and marine spatial planning International Journal of Biodiversity Science Ecosystem Services & Management.
- Guo X. K. P. Price & J. Stiles (2003) Grasslands discriminant analysis using Landsat TM single and multitemporal data. Photogrammetric Engineering and Remote Sensing 69 1255-1262.
- Henry M. C. (2008) Comparison of single-and multi-date Landsat data for mapping wildfire scars in Ocala National Forest Florida. Photogrammetric engineering and remote sensing 74 881-891.
- Interdisciplinary Research Team Summaries (2012) Ecosystem Services: Charting a Path to Sustainability The National Academy Press 136 p. Accessed July 31 2013 at http://www.nap.edu/download.php?record_id=13331.
- Johnson K. A. S. Polasky E. Nelson & D. Pennington (2012) Uncertainty in ecosystem services valuation and implications for assessing land use tradeoffs: An agricultural case study in the Minnesota River Basin. Ecological Economics 79 71-79.
- Keeler B. L. S. Polasky K. A. Brauman K. A. Johnson J. C. Finlay A. O’Neill K. Kovacs & B. Dalzell (2012) Linking water quality and well-being for improved assessment and valuation of ecosystem services. Proceedings of the National Academy of Sciences 109 18619-18624.
- Kinzig A. P. C. Perrings F. S. Chapin S. Polasky V. K. Smith D. Tilman & B. L. Turner (2011) Paying for Ecosystem Services—Promise and Peril. Science 334 603-604.
- Kinzig A. P. C. Perrings F. S. Chapin S. Polasky V. K. Smith D. Tilman & B. L. Turner (2012) Response—Ecosystem Services: Free Lunch No More. Science 335 656-657.
- Koutsias N. M. Karteris & E. Chuvico (2000) The use of intensity-hue-saturation transformation of Landsat-5 Thematic Mapper data for burned land mapping. Photogrammetric Engineering and Remote Sensing 66 829-840.
- Kreuter U. P. H. G. Harris M. D. Matlock & R. E. Lacey (2001) Change in ecosystem service values in the San Antonio area Texas. Ecological Economics 39 333-346.
- Luck G. W. G. C. Daily & P. R. Ehrlich (2003) Population diversity and ecosystem services. Trends in Ecology & Evolution 18 331-336.
- Lunetta R. S. & M. E. Balogh (1999) Application of multi-temporal Landsat 5 TM imagery for wetland identification. Photogrammetric Engineering and Remote Sensing 65 1303-1310.
- Metzger M. J. M. D. A. Rounsevell L. Acosta-Michlik R. Leemans & D. Schröter (2006) The vulnerability of ecosystem services to land use change. Agriculture Ecosystems & Environment 114 69-85.
- National Research Council Committee on the Effects of the Deepwater Horizon Mississippi Canyon-252 Oil Spill on Ecosystem Services in the Gulf of Mexico (2012) Approaches for Ecosystem Services Valuation for the Gulf of Mexico after the Deepwater Horizon Oil Spill: Interim Report The national Academiec Press 162 p. Accessed July 31 2013 at http://www.nap.edu/catalog.php?record_id=13141.
- National Research Council Committee on Assessing and Valuing the the Services of Aquatic and Related Terrestrial Ecosystems (2004) Valuing Ecosystem Services: Toward better Environmental Decision-Making The National Academies Press 277 p. accessed July 31 2013 at http://www.nap.edu/catalog.php?record_id=11139.
- National Research Council Committee on River Science at the U.S. Geological Survey (2007) River Science at the U.S. Geological Survey The National Academy Press 206 p. Accessed July 31 2013 at at http://books.nap.edu/catalog.php?record_id=11773
- Nelson E. G. Mendoza J. Regetz S. Polasky H. Tallis D. Cameron K. M. A. Chan G. C. Daily J. Goldstein P. M. Kareiva E. Lonsdorf R. Naidoo T. H. Ricketts & M. Shaw (2009) Modeling multiple ecosystem services biodiversity conservation commodity production and tradeoffs at landscape scales. Frontiers in Ecology and the Environment 7 4-11.
- Reyers B. S. Polasky H. Tallis H. A. Mooney & A. Larigauderie (2012) The Common Ground of Biodiversity and Ecosystem Services Demonstrated: A Response to Faith. BioScience 62 785-786.
- Ruckelshaus M. McKenzie E. Tallis H. Guerry A. Daily G. Kareiva P. Polasky S. Ricketts T. Bhagabati N. Wood S. A. Bernhardt J. (2013). Notes from the field: Lessons learned from using ecosystem service approaches to inform real-world decisions. Ecological Economics http://dx.doi.org/10.1016/j.ecolecon.2013.07.009.
- Satz D. R. Gould K. A. Chan A. Guerry B. Norton T. Satterfield B. Halpern J. Levine U. Woodside N. Hannahs X. Basurto & S. Klain (2013) The Challenges of Incorporating Cultural Ecosystem Services into Environmental Assessment. AMBIO 1-10.
- Terrado M. V. Acuña D. Ennaanay H. Tallis & S. Sabater (2013) Impact of climate extremes on hydrological ecosystem services in a heavily humanized Mediterranean basin. Ecological Indicators.
- Xu H. (2007) Extraction of urban built-up land features from Landsat imagery using a thematic-oriented index combination technique. Photogrammetric Engineering and Remote Sensing 73 1381.
Acknowledgements
We would like to express our appreciation to Mr. Gregg Verutes from Natural Capital Project for providing consultancy. The Natural Capital Project is a partnership among Stanford University The Nature Conservancy the World Wildlife Fund and the University of Minnesota that works to develop and provide practical ecosystem services tools and approaches apply these tools in select areas around the world and engage influential leaders to advance change in policy and practice through mainstreaming. We also would like to thank the 2014 SAC GeoLeague Advisory Committee for their guidance. Many of the data sets provided for this challenge were acquired and produced by Belize’s Coastal Zone Management Authority and Institute (http://www.coastalzonebelize.org).