broadbands (e.g., 6 non-thermal Landsat), typically, achieve
~30% fewer accuracies (Thenkabail
et al.
, 2004b). Methods of
classification of vegetation using HNBs include multivariate
or partial least square regressions, discriminant analysis,
unsupervised classification, supervised approaches, spectral
angle mapper (SAM), artificial neural networks, and support
vector machines (SVM) (Zhang
et al.
, 2000; Thenkabail
et al.
,
2011b).
H
ughes
’ P
henomenon
Hyperspectral data can have 100s or even 1000s of
bands. However, with increased number of hyperspectral
narrowbands the number of samples (i.e., training pixels)
required to maintain minimum statistical confidence and
functionality in hyperspectral data for classification purposes
grows exponentially, making it very difficult to address this
issue adequately. For example, if we were to classify 10 land
cover classes using 100s or 1000s of HNBs, we will require
very large training samples for each class in order to establish
statistical integrity of classification, whereas broadband
data like Landsat can be classified with significantly fewer
training samples for every class. Also, greater dimension of
hyperspectral data allows greater number of classes to be
achieved. Naturally, it is of great advantage to have a large
number of HNBs to classify complex land cover classes.
However, its statistical integrity can only be maintained if
each class has enough training samples to train the classifier
and equally large number of training samples for each class
to establish the class accuracy. So, what is a blessing can
also turn to a curse. This phenomenon is known as
Hughes’
phenomenon
or
curse of dimensionality
of data (Thenkabail
et
al.
, 2011b; Thenkabail
et al.
, 2013). Nevertheless, it must be
stated that modern access to multitude ways of instantaneous
gathering of image data (e.g., potential from hundreds
and even thousands of micro satellites such as Planet Labs
gathering images over Planet), evolution of super-computing
on desktop and mobile platforms, and smart algorithms will
help overcome this “curse”.
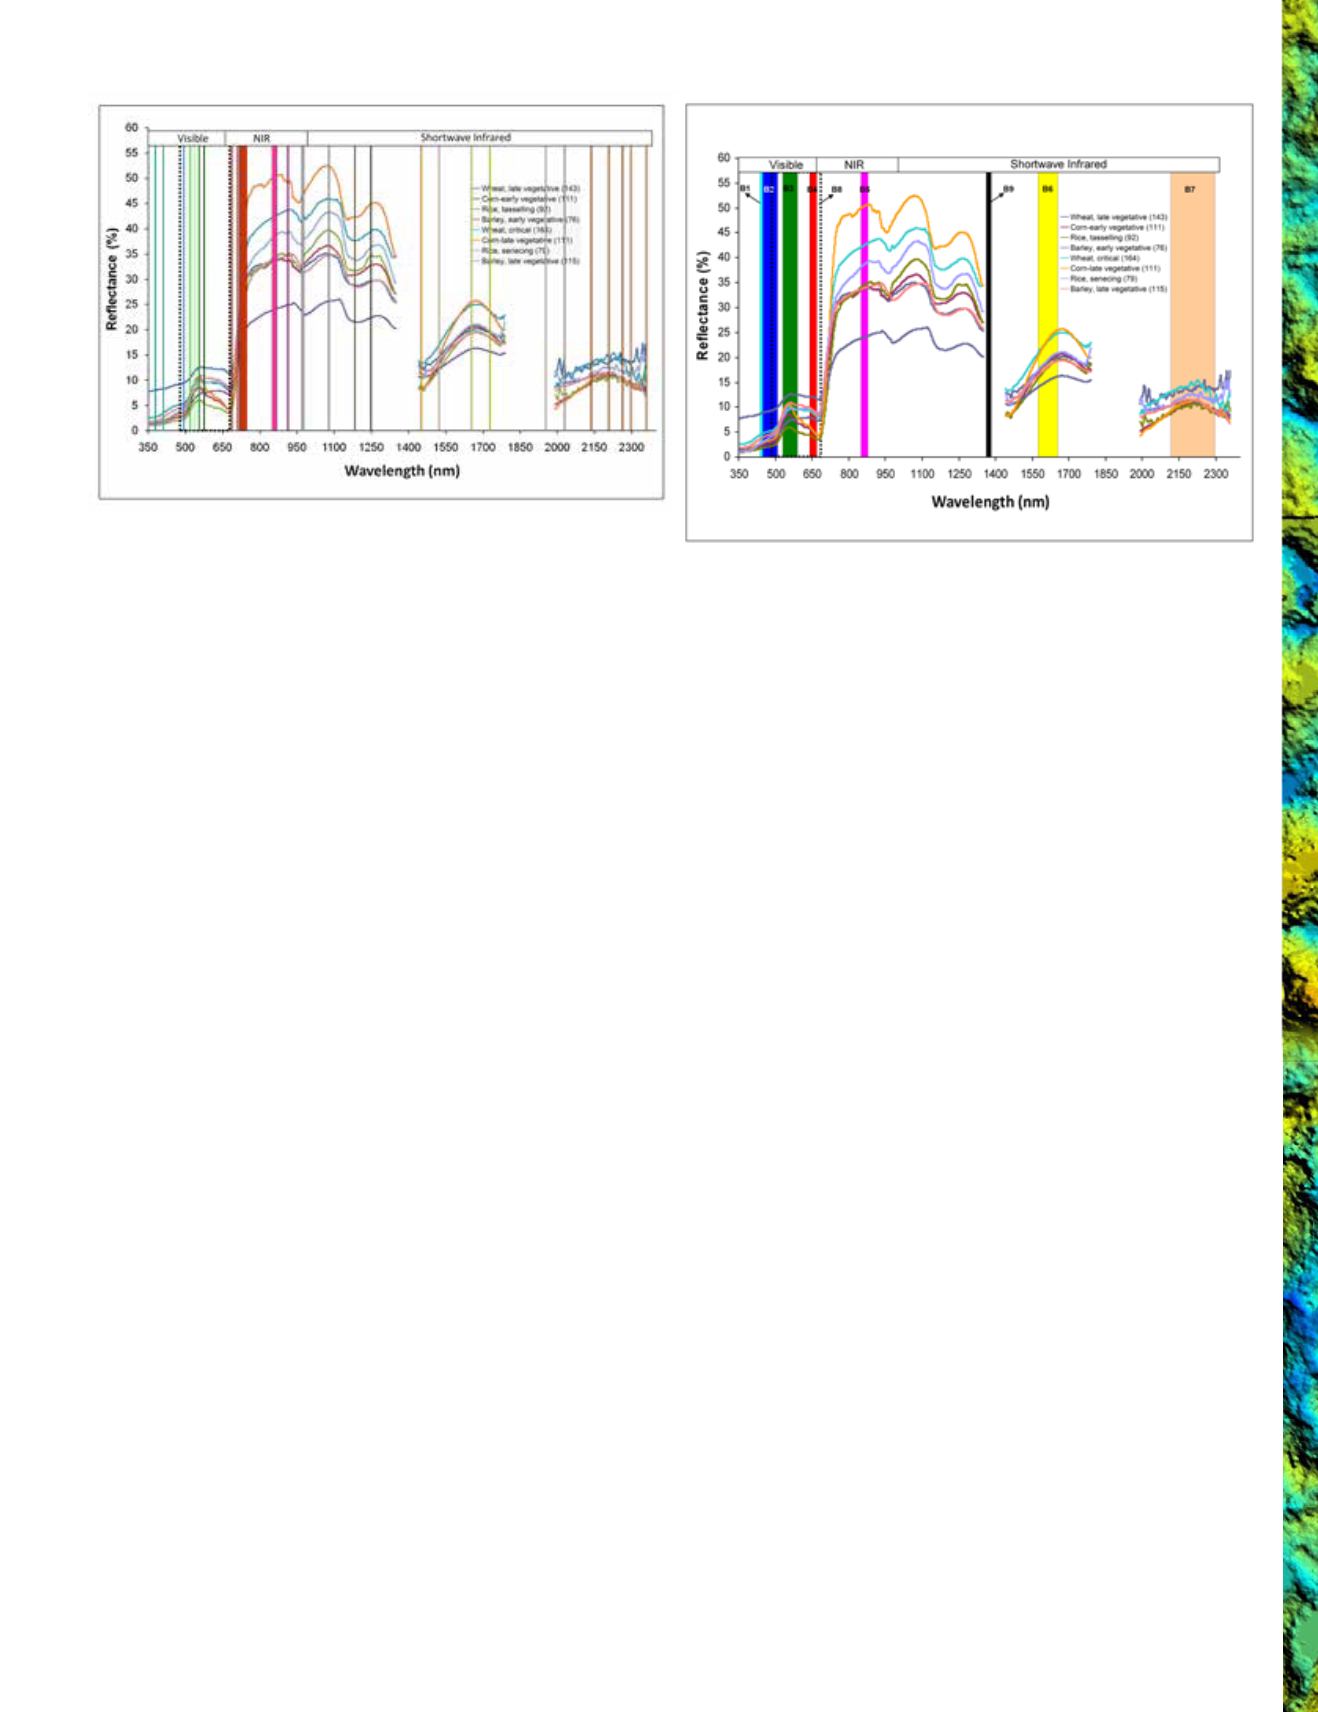
Figure 4.
Optimal hyperspectral narrowbands (HNBs; Figure 4a) and Landsat-8 broadbands (BBs; Figure 4b): showing the band centers and
widths. These band centers and widths are plotted on spectroradiometer measured hyperspectral signatures for certain key crops. The 28 bands
shown in Figure 4a are derived from Table 2. The 9 non-thermal bands of the Landsat-8 are shown in Figure 4b.
“Hughes’ Phenomenon: With the
increased number of hyperspectral
narrowbands the number of samples
(i.e., training pixels) required to
maintain minimum statistical
confidence and functionality in
hyperspectral data for classification
purposes grows exponentially, making
it very difficult to address this issue
adequately. This problem is known
as Hughes’ Phenomenon and can
be addressed by overcoming data
redundancy and/or through obtaining
large number of training pixels for
each class”.
PHOTOGRAMMETRIC ENGINEERING & REMOTE SENSING
August 2014
703


