Given the above facts, spaceborne hyperspectral platforms
(e.g., Table 1; also see Ortenberg, 2011; Qi, 2011) offer pow-
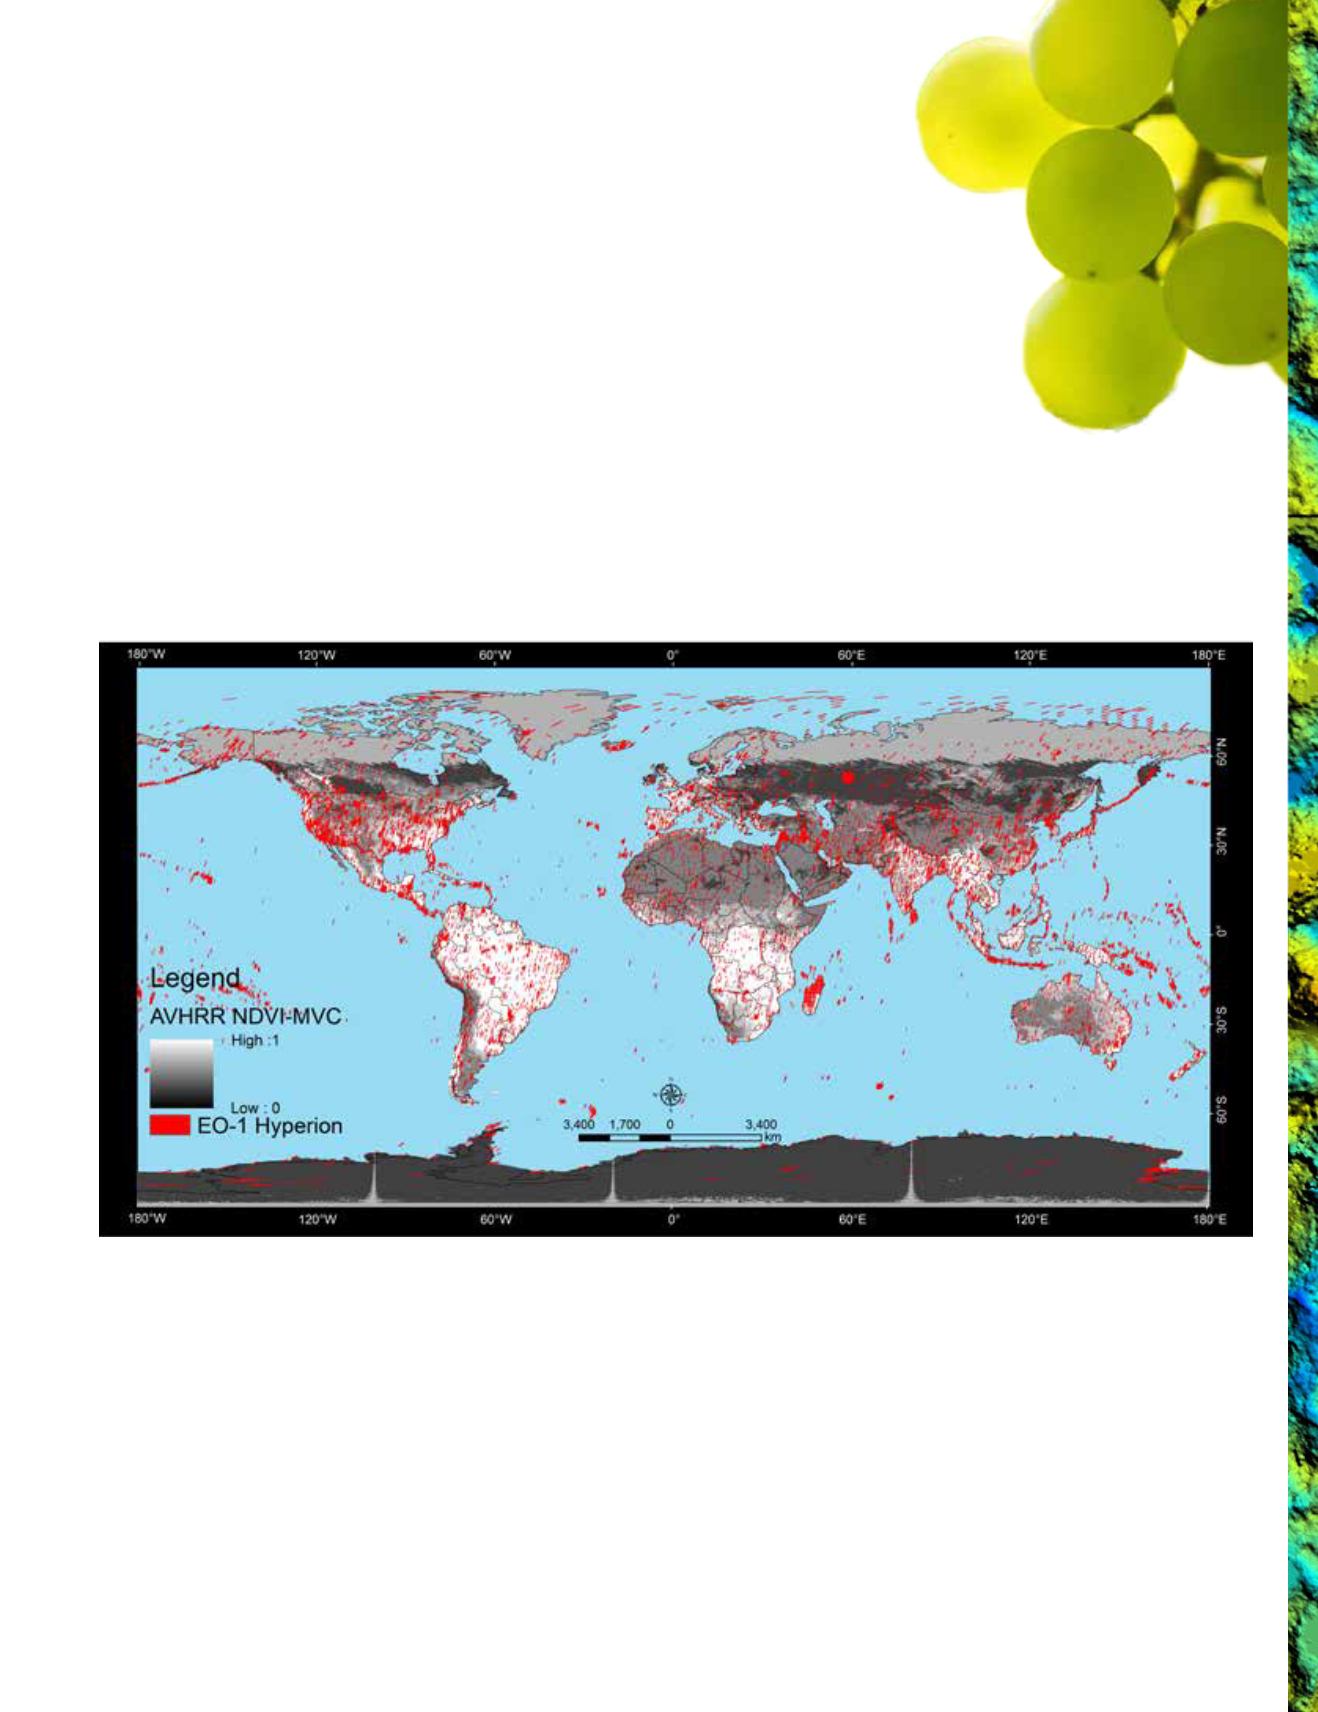
erful option for repeated, consistent global coverage. For ex-
ample, already there are now ~64,000 Hyperion images (Fig-
ure 1) acquired by the Earth Observing-1 (EO-1; Middleton
et
al.
, 2013) satellite from 2000 to 2013. These images, each of
7.5 km by 180 km in 242 bands over 400 to 2500 nm, offer a
great opportunity to study terrestrial land features including
vegetation and agricultural crops around the world with much
greater detail and higher accuracies than any multispectral
sensor (Thenkabail
et al.
, 2011b). For example, it is feasible
to establish a significant spectral library of agricultural crops
(Figure 2 derived from Hyperion images) around the world
using Hyperion images with adequate prior knowledge about
what was grown where and when (which in turn can be gath-
ered from field data from national databases for many places
in the world). However, the poor signal to noise ratio of Hype-
rion as well as atmospheric effects influencing the signatures
“Development
of precise
spectral
libraries of various
vegetation or crop types
and their species,
gathered at various
phenological growth
stages, is one of the
primary requirement to make fullest
use of the tremendous strengths of
hyperspectral data”
Figure 1.
Hyperion hyperspectral image coverage of the World from 2001-2013. Hyperion, the first commercial hyperspectral sensor, onboard
Earth Observing-1 (EO-1) was launched on November 21, 2000 and has acquired a total of ~64,000 images by August, 2013. Each of these 185
km x 7.5 km image tiles has a total of 242 bands, with each being 10 nm widespread over 400-2500 nanometer, 30 m spatial resolution, and 12-
bits radiometric resolution. With each image having 5.25 gigabyte of data, there is 336 terabyte of data from ~64,000 images. These images are
freely downloadable from USGS EarthExplorer (
/).
need to be kept in mind. Similarly, much of the forest vegeta-
tion (e.g., species composition) or other natural vegetation in
specific locations may remain the same over years. Hence, one
could use the collection of ~64,000 Hyperion images (Figure 1)
to establish spectral libraries of specific forest or other vegeta-
tion species or categories. Also, hyperspectral images such as
Hyperion will allow us to simulate other broadband data (e.g.,
Landsat, IKONOS, Resourcesat) and will help us compare the
broadband classification results with narrowband classifica-
tion results (Bruzzone
et al.
, 1997; Thenkabail
et al.
, 2013)
over the same area. Such studies will allow for better under-
standing of strengths, limitations, and challenges of using hy-
perspectral data and prepare us for applications when new hy-
perspectral missions (e.g., Table 1) are launched and ready. As
PHOTOGRAMMETRIC ENGINEERING & REMOTE SENSING
August 2014
699


