PHOTOGRAMMETRIC ENGINEERING & REMOTE SENSING
July 2014
603
satellite images, local people’s perceptions provide the supportive
information to explain these patterns. We used Multispectral
Scanner (MSS) and Thematic Mapper (TM) images from 1972 to
present to calculate vegetation indices and land cover trajectories
for different vegetation covers in stratified elevation zones (Figure
5). To address the increasing need for integration of spatial and
social data as a means of explaining and attributing landscape
changes to factors such as different management efficiencies and
enforcement strategies, growing tourism pressures and climate
variability, we conducted opportunistic key informant interviews
and livelihoods surveys. The spatially explicit and georeferenced
socio-economic data was collected by trained graduate students in
local languages who not only gained valuable experience but were
also able to show locals satellite images of their villages and fields
and the newest geolocation technology.
We focused much of our energy so far on Sagarmatha and
Makalu Barun National Parks not only because they are adjacent
and both lie at the foot of Mt. Everest, sharing similar bio-physical
characteristics, but also because they are among the flagship parks
in Nepal and thus most under pressure from tourism and local
activities. However, while Sagarmatha NP was well protected
even during the civil war due to the fact that it is the access point
for Mt. Everest climbers, Makalu Barun was a major stronghold
for the rebels. These parks thus represented great opportunities
to begin to disentangle the impacts of environmental variability
from human management decisions on the landscape. This work
used the extensive Landsat imagery archive to examine land cover
both before and after the civil war to tease out the differing land
cover trajectories. Additionally, land cover data derived from the
International Center for Mountain Research and Development
(ICIMOD) were used to validate the analysis. Over 850
ground reference data points were collected by ACSP
personnel and Nepalese students during field visits in
2009/10. Opportunistic and systematic field interviews
were conducted to elicit people’s perception on causes
and consequences of land cover changes within the two
national parks as well.
R
esults
S
ummary
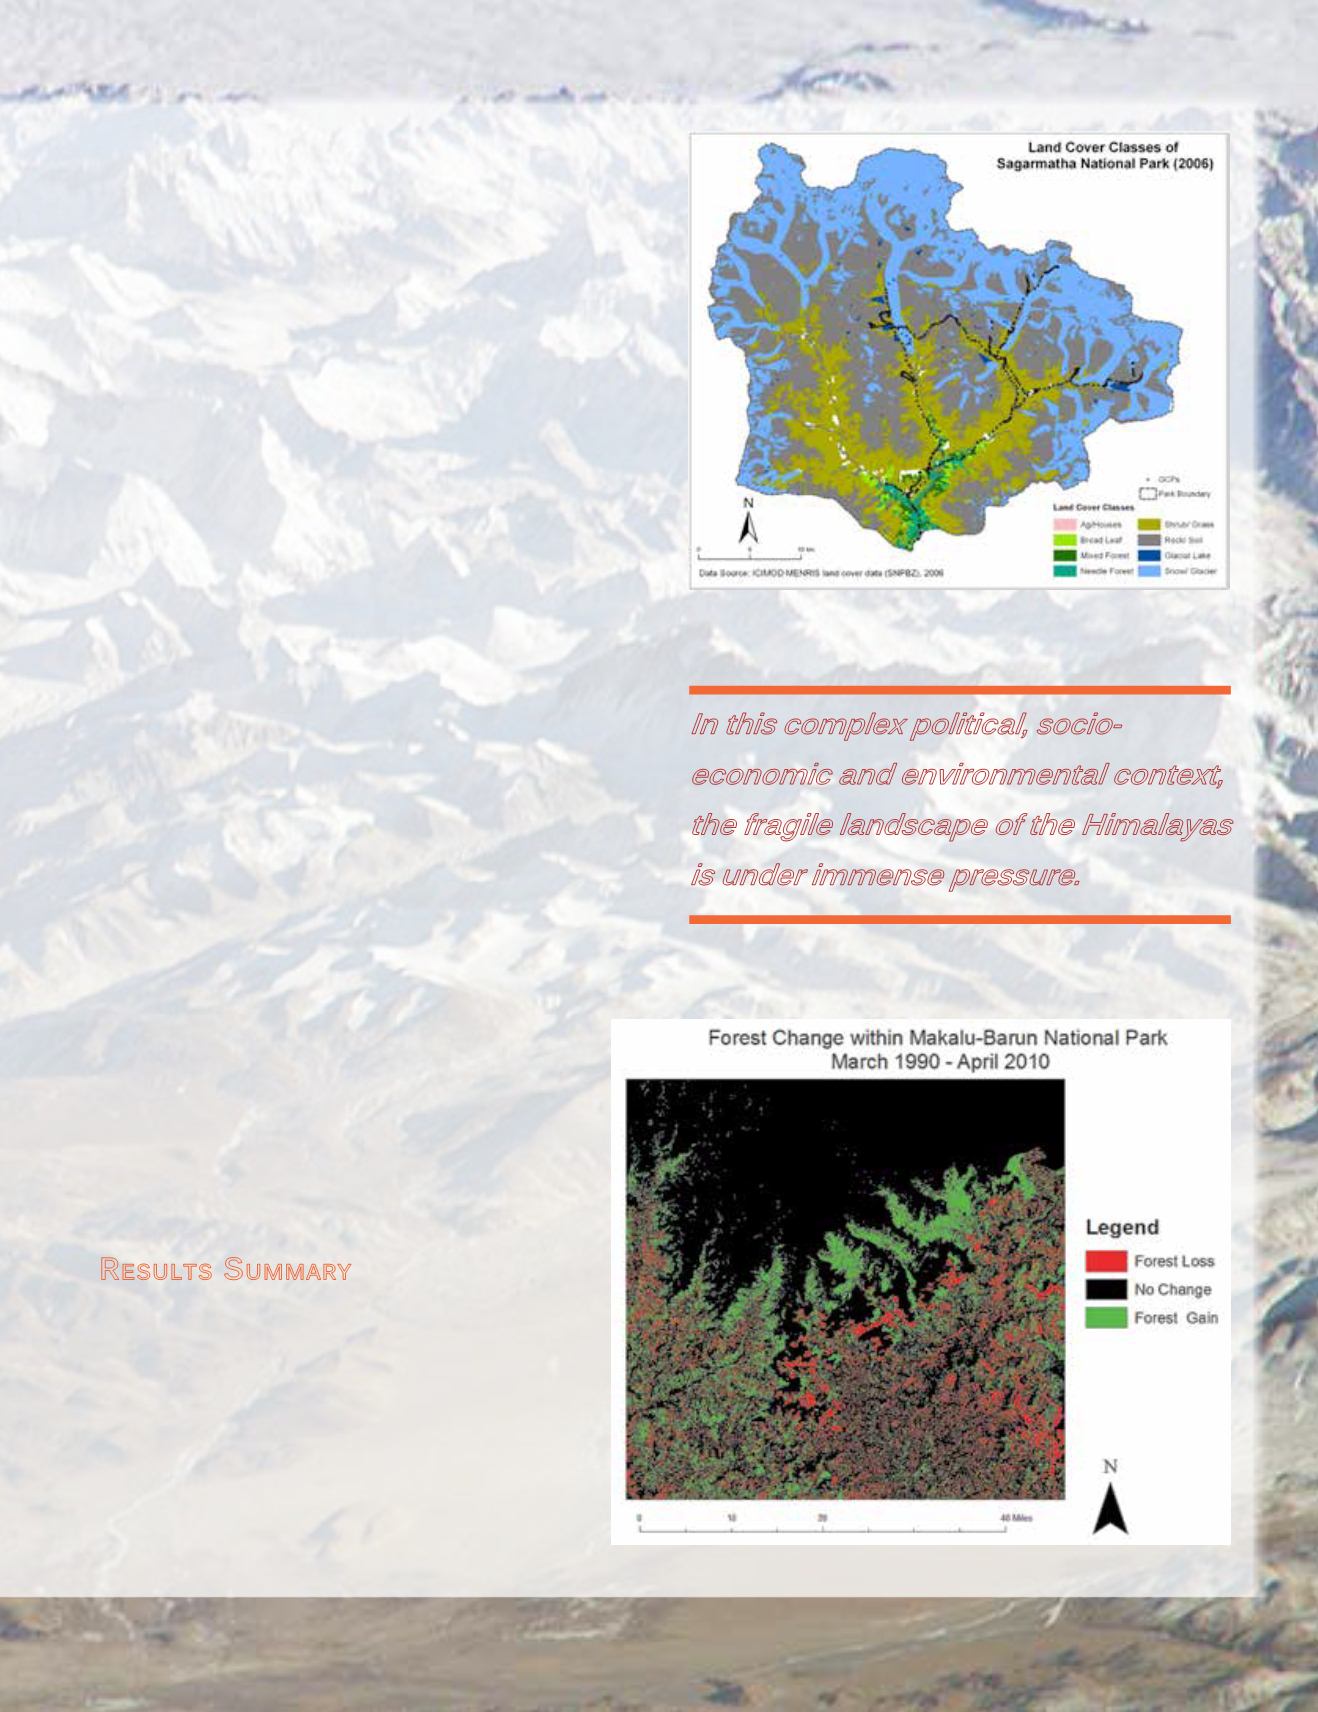
We analyzed different vegetation indices and land cover
change trajectories, but for brevity sake we will discuss
spatial patterns of normalized difference vegetation
index (NDVI) and land cover changes here. For instance,
the trend in average growing season NDVI values for
Sagarmatha NP showed an increase in mean vegetation
productivity for the period of 1972-2010. However,
local stakeholder interviews and ground control points
suggest a decrease in forested areas in both national
parks, but far more intense in Makalu Barun (Figure 6).
Figure 5: Sagarmatha National Park Land Cover Classes (2006).
Figure 6: Forest Change in Makalu Barun National Park (1990-2010).
In this complex political, socio-
economic and environmental context,
the fragile landscape of the Himalayas
is under immense pressure.


