Discussion
In this article we presented a methodology for reference
height optimization based on
MIC
, that can be automated in
metric computation. Our results show that the precision of
the final model could be improved by tailoring a different
reference height to each metric. Therefore, we advise that
reference heights should be optimized to each metric, rather
than subjectively fixed for all them collectively, which is com-
mon practice. In two-phase estimation schemes (e.g., Naesset
2002; Andersen
et al
. 2005; Hudak
et al.
2008), by carrying
out the optimization at the training sample (first phase), the
resulting reference heights can be implemented differently for
each metric during wall-to-wall computation of
ALS
metrics
(second phase).
When no reference height is applied, the
ALS
height dis-
tributions typically present a bimodal shape, with a lower
peak representing the ground and understory returns and an
upper peak represents the returns backscattered from tree
crowns (Figure 4). As the metrics are summary statistics of
this distribution, excluding returns below the reference height
threshold critically modifies the shape of that distribution,
and subsequently the statistics, which describe them. As the
returns backscattered from the crowns remain in the distribu-
tion, the higher percentiles are little affected (Figure 3). On
the other hand, the lower percentiles and descriptors of cen-
tral tendency (e.g., mean) are strongly influenced by modifica-
tions in the reference height (Figure 1).
Higher percentiles, like H90, were the most robust metrics
against changes in
Hmin
. The main reason for that is the na-
ture of the statistic. Since percentile is a position descriptor,
applying the
Hmin
implicates in change of only one side of
the distribution. Thus, lower percentiles, which represent one
side of the distribution, are more sensitive to these changes.
However, although lower percentiles showed lower
MIC
values, they are likely to be uncorrelated to the higher per-
centiles and therefore they may have potential for explaining
proportions of variance unexplained by other metrics. They
may thus be significant and thereby setting
MinH
properly for
them may be important.
Therefore, not all metrics respond in a same way to chang-
es in the reference heights (Figures 1, 2, and 3), as their rela-
tion to stand volume may weaken for some while strengthen-
ing for others. If an automated variable selection procedure
is used (Næsset, 2002; Andersen
et al
., 2005; Hudak
et al
.,
2006), it converges into selecting the strongest metrics in each
case. Therefore, whenever a weakened metric is dismissed,
another with roughly similar explanatory potential substi-
tutes it, and therefore changing height thresholds simply lead
to different metric selection. For this reason, the accuracy
of final models is barely affected (Næsset, 2011; Montaghi
personal communication in Wulder
et al
., 2013). Hence, our
study metric-by-metric brings better insights on the actual ef-
fect of changing reference height thresholds, and the essence
of their influence in
ALS
metric computation.
Besides of the novelty of the optimization method, the
most important finding of this study considering relations to
metrics one-by-one has been to observe how changing refer-
ence heights have a roughly opposite effect for two groups of
metrics. The first group are those which benefit from using a
higher
MinH
to mask out returns backscattered from ground
or other non-relevant elements. These are
ALS
height metrics
describing central tendency (Figure 1a.1 and 1b.1), shape (Fig-
ure 1a.3 and 1b.3), or order statistics and percentiles (Figure
3). The second group are those metrics, which should rather
include the ground points in the computation. We observed
that density metrics including a lower
Hbreak
(Figure 2) can
be good for evaluating canopy cover in the sense of defining
the proportion of returns reaching the ground. This shows the
importance of distinguishing studies applying
MinH
against
those using
HBreak
, and this is the reason why we put em-
phasis on stressing this difference in the Introduction. It also
implies the need for tailoring reference heights to each metric,
since otherwise different fixed thresholds just lead to a loss of
predictive potential for different metrics. Figure 5 illustrates
the reasons for different effects observed for height or density
metrics, using two examples on how the modification in refer-
ence height changes the relation with stand volume for two
metrics: MEAN as height metric and RATIO.MEAN as density
metric (see Table 2). In light of our results, we recommend
that reference height thresholds are to be tailored to specific
metrics, i.e., at least differentiating these groups.
Among the height metrics, those describing the dispersion
of
ALS
heights (Figure 1a.2 and 1b.2) had similar response of
the density metrics. When computing the dispersion of all
returns, it was especially relevant how their
MIC
decreased
dramatically after eliminating the ground hits. This result may
suggest that, like canopy cover metrics, the dispersion of all
returns may partially explain the relative density, as it would
be highly influenced by the size of the lower peak in Figure 4.
Density metrics describing canopy cover have a weaker re-
lation to stand volume, and our results showed that their ex-
planatory capacity becomes blurred when increasing
HBreaks
(Figure 5). Our results may therefore explain why height met-
rics are much more commonly selected than density metrics
when modeling stand volume (Maltamo
et al.
, 2006; Zonete
et al
., 2010; Stephens
et al
., 2012; Gonzalez-Ferreiro
et al
.,
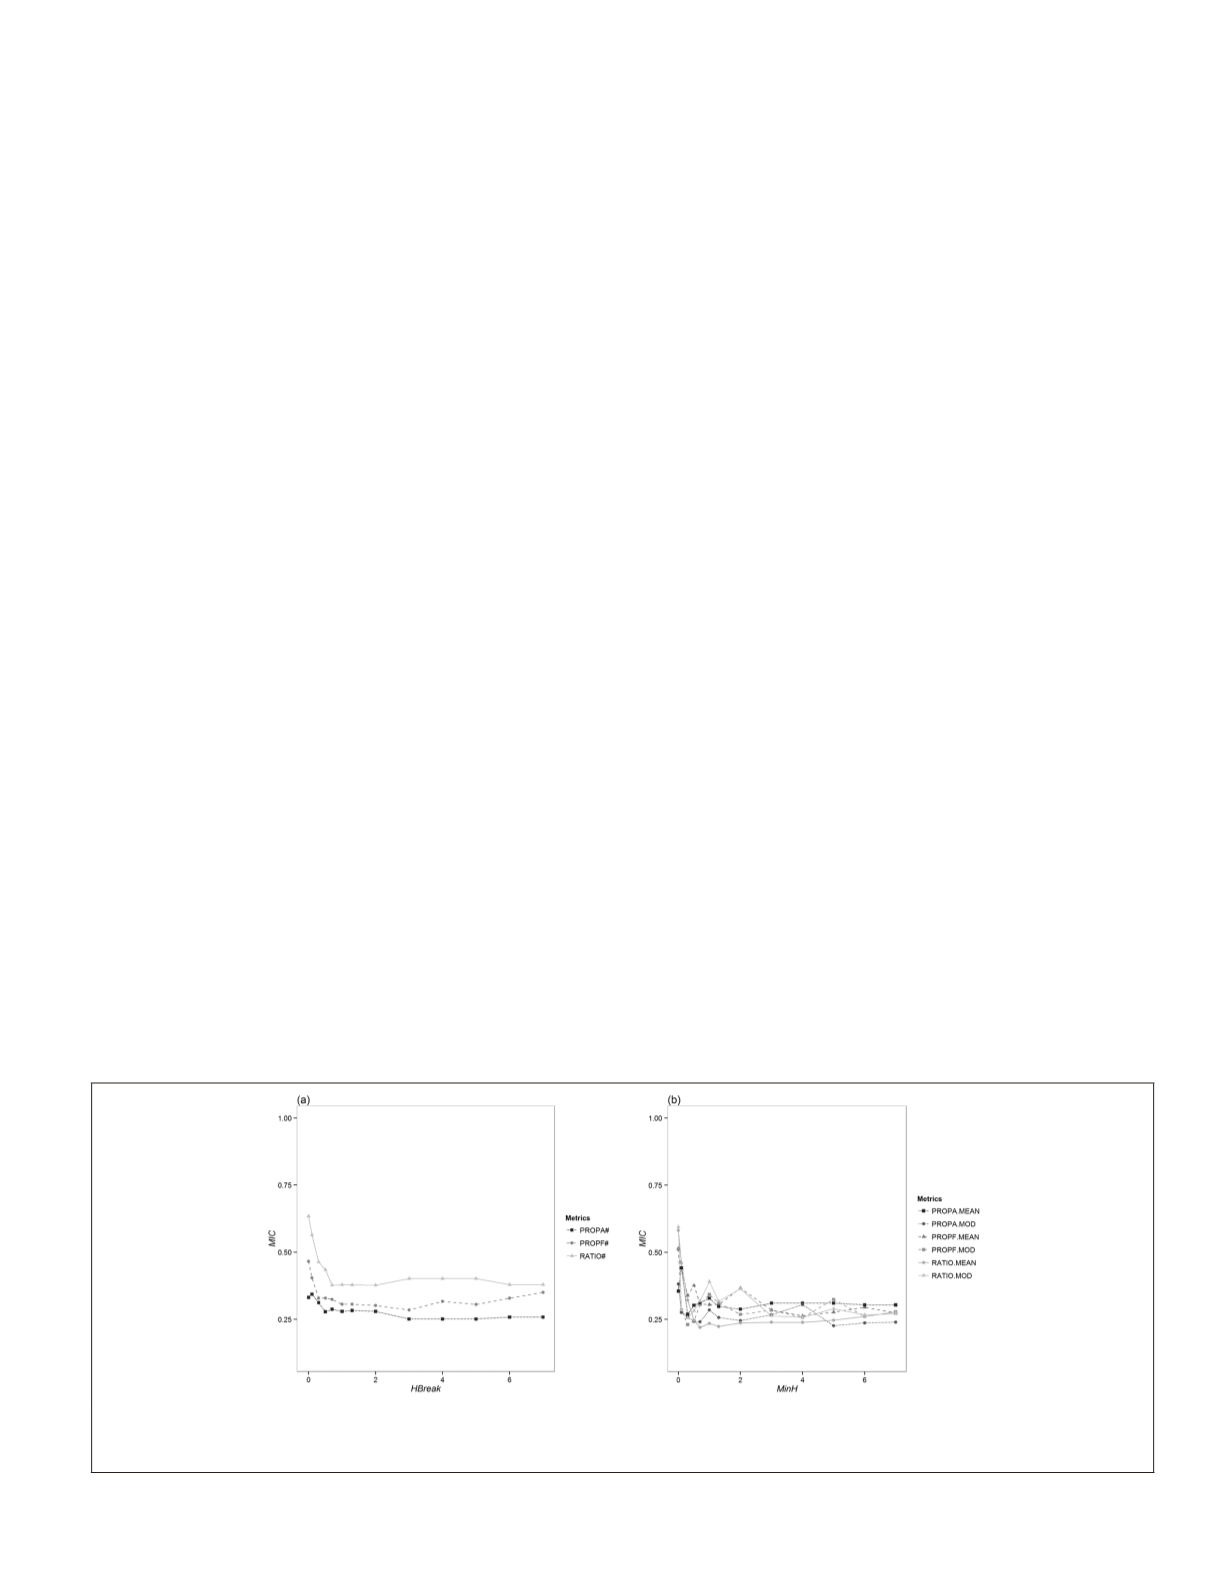
Figure 2. Maximal Information Coefficient (
MIC
) of the density metrics (canopy cover) by increasing reference height: either
height break (
HBreak
, left) or minimum height (
MinH
, right). They are grouped following Table 2, i.e., into metrics with (a)
fixed or (b) variable
HBreak
. See Table 2 for metric definitions.
PHOTOGRAMMETRIC ENGINEERING & REMOTE SENSING
May 2017
347


