PHOTOGRAMMETRIC ENGINEERING & REMOTE SENSING
December 2016
911
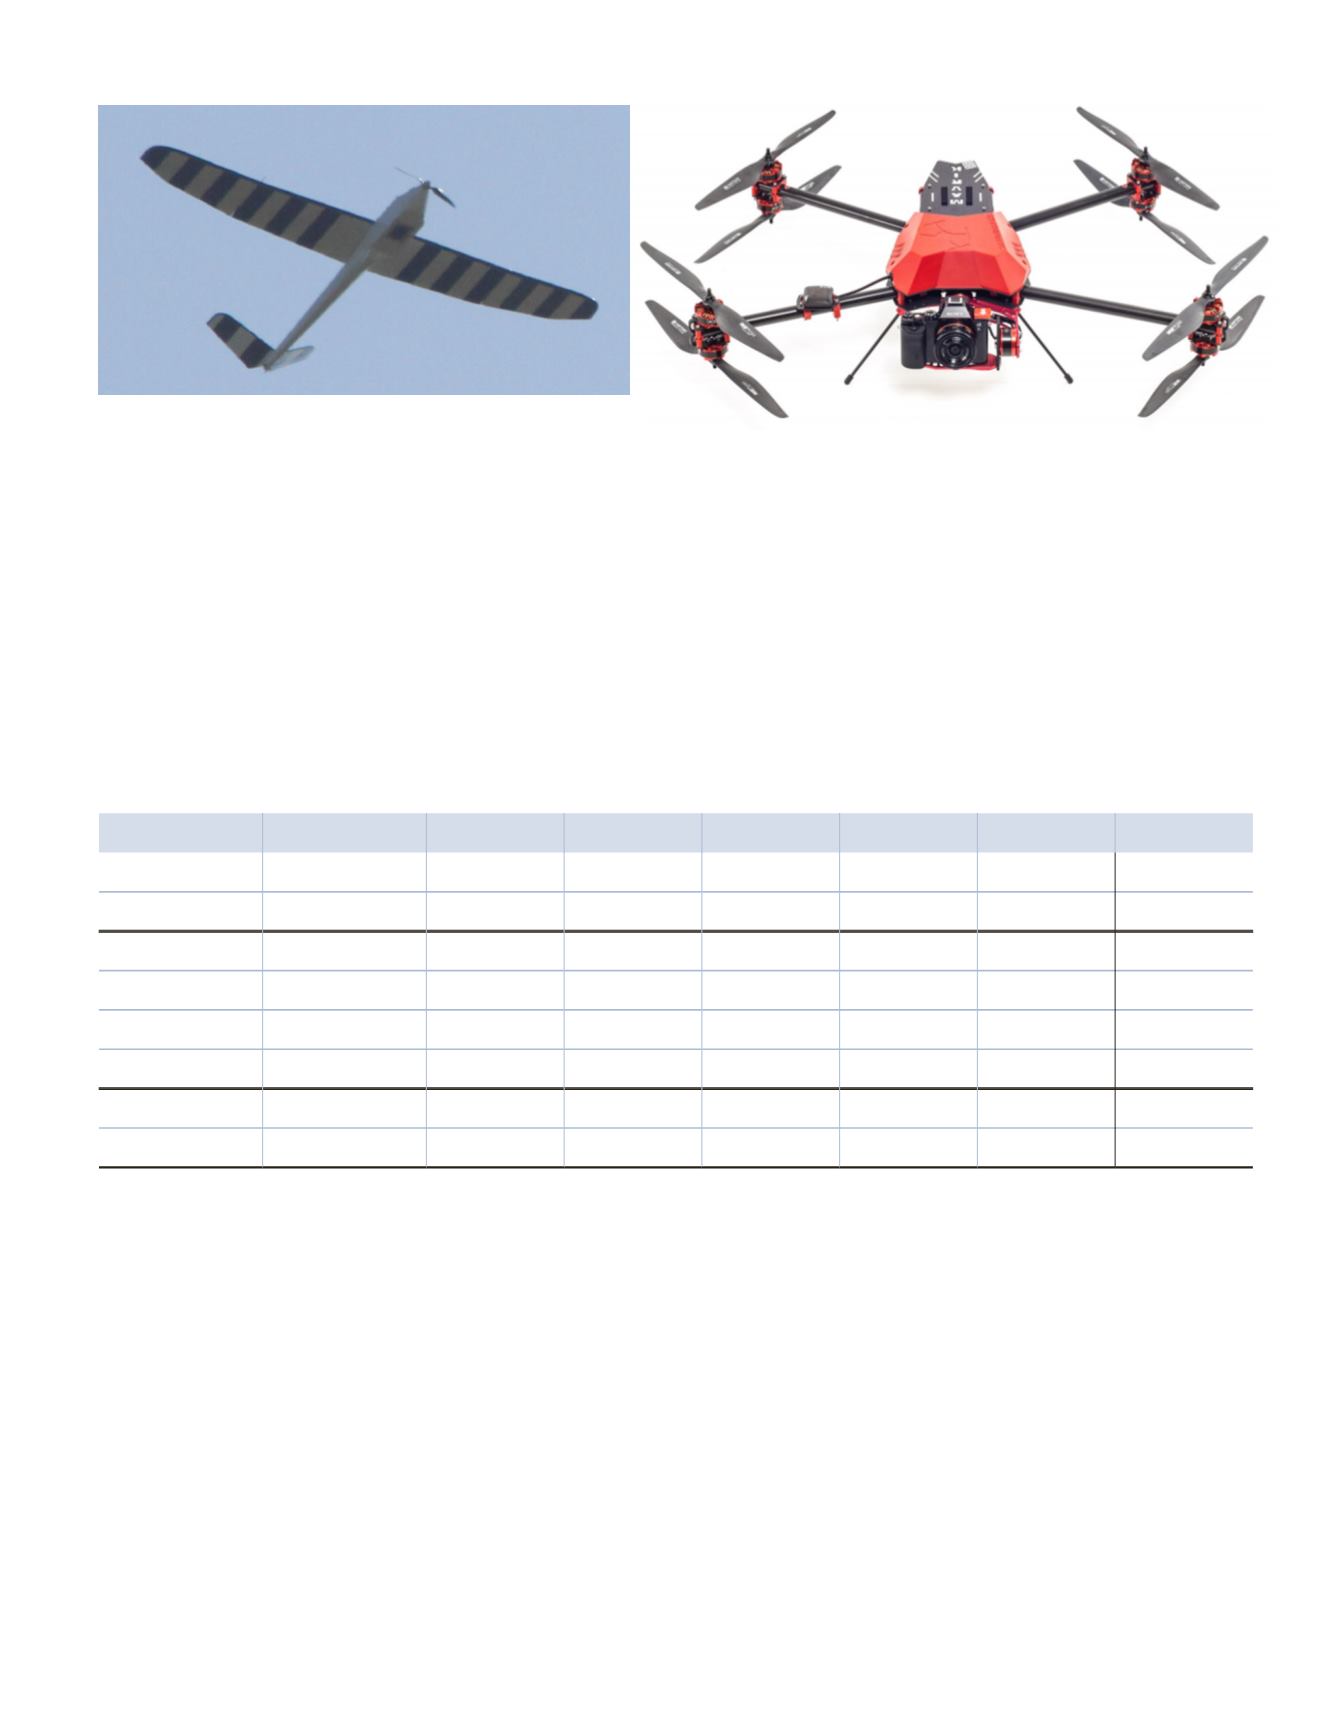
Figure 2: Altavian Nova F6500 UAS in Flight
Acquisition comparison
Keystone flew the four aircrafts over the project area at
several altitudes and sensor combinations. Table 1 details
the three imagery collections.
In the fourth flight, the Galaxy lidar captured the area in
4 strips in 13 minutes of production flight time. The point
density averaged 17.8 points per square meter using a pulse
repetition frequency of 300 kHz and a scan frequency of 92
Hz at an altitude of 3,000 feet AGL.
P
hotogrammetric
P
rocessing
Aerial Triangulation (AT)
Keystone used Pix4Dmapper Pro for the initial UAS imagery
processing. The UAS workflow in Mapper Pro consists of im-
porting the images and the navigation information from ei-
ther the Exif data embedded in the image or from an external
file. At this point, a rapid processing is done to tie the images
together in relative space. All points to be used are then mea-
sured and set as either control or check points and a full AT
is performed. After checking the results and making adjust-
ments as needed, a full point cloud and other deliverables are
made. For the purpose of comparison to the Falcon imagery,
Figure 3: SteadiDrone Mavrik X8 UAS with Sony Camera
Table 1: Comparison of flight times, imagery bands, ground sample distance and image counts.
Platform
Sensor
Bands
GSD
Altitude
Lines
Images
Time
Cessna 210
UC FalconP
RGBI
4cm
2575 ft.
2
20
4 min
Cessna 210
UC FalconP
RGBI
2cm
1375 ft.
3
48
6 min
F6500
Canon
RGB
2.76cm 400 ft.
7
192
6 min
F6500
Canon
RGB
1.38cm 200 ft.
9
231
11 min
F6500
Canon
CIR
2.76cm 400 ft.
7
192
6 min
F6500
Canon
CIR
1.38cm 200 ft.
9
231
11 min
Mavrik
Sony
RGB
1.47cm 400 ft.
4
72
5 min
Mavrik
Sony
RGB
0.72cm 200 ft.
7
285
13 min
computations using various control point amounts are run:
2 control with 13 check, 3 control with 12 check and 5 control
with 10 check.
Detailed in Table 2 below are some of the quality report-
ing elements from the point matching, bundle adjustment and
camera calibration performed by Pix4D for the UAS flights
under various altitudes and control patterns. Of interest is
the camera optimization column, which is the percentage of
change of the lens focal length calculated and used by the soft-
ware in order to optimize the solution. As can be seen by the
amount of adjustments made to the focal length, the Principal
Point (PP) x and Principal Point (PP) y, although the percent-
ages remain small and within acceptable limits, the values
themselves vary. The amount of change for the Sony is small-
er, but varies, whereas the Canon has a larger but more stable
parameter adjustment. This is likely due to lens factors such
as stability, heat and vibrations. The average amount of 3D
points generated per image is very consistent between GCP
configurations, but varies based on sensor and altitude.
For the large format camera imagery, a standard photo-
grammetric workflow using the Inpho suite and the same
control/check patterns were implemented. Below, in Table


