660
September 2016
PHOTOGRAMMETRIC ENGINEERING & REMOTE SENSING
comparing it to the distance on the ground—something that
has never been done nor something anyone is intending to
do in the future.
The criteria given in (2) which uses c-factor to determine
the appropriate contour interval that can be generated
from an elevation dataset, is no longer valid for digital
cameras products and softcopy workflow. C-factor is a
term developed to express the physical limitations of the
mechanical movements of the analogue stereo plotters and
its tolerance to the variation in terrain relief. It should not
be used for all-digital workflow. We used the flying altitude
in such formula when the aerial imagery was strictly done
using one film camera geometry, and that is a 9x9-inch film
format and a lens with 6-inch focal length. Flying altitude
alone can no longer be used to determine products accuracy.
Digital cameras of today come with different formats and
lens focal lengths. Digital cameras such as UltraCAM
Eagle with 210-millimeter lens or A3 from Vision Map
with 300-millimeter lens are capable of acquiring high-
resolution digital imagery from a very high altitude. An
UltraCAM-210 camera for example is capable of acquiring
imagery with a ground resolution of 15 centimeters from
an altitude of 19,870 feet above ground level (AGL). Using
film-based cameras, we use to acquire photography from
an altitude of 3,600 ft. with a negative scale of 1:7,200 to
obtain the same ground resolution of 15 centimeters after
scanning the film with 21 micron/pixel. Using the above
formula in (2) for both scenarios results in a product
that meets 2-foot contour interval criteria from the film
photography while it only meets 11-foot contour interval
criteria from an UltraCAM-210 sensor. Such conclusion
will be rejected by Vexcel, the manufacturer of UltrCAM,
and all UltraCAM cameras owners who claim that their
products from the UltraCAM-210 sensor can meet the
highest accuracy requirements horizontally and vertically.
As for the question on whether digital imagery with a GSD
of 10 centimeters satisfies a certain map scale, I do not have
a straight answer as there is none. However, I will provide
some guidelines that may put you closer to what your client
is trying to achieve. When we first transitioned to softcopy
workflow in the early ‘90s, we scanned the film to convert
it to a digital media. The main concern at the time was the
scanning resolution needed to produce a certain map scale.
There was no one answer and different companies used
different scanning resolution. The most common scanning
resolution adopted at the time was 1200 dots-per-inch
(dpi) or 21-micron. Based on such scanning resolution, we
developed the association between the film scale, GSD, and
the resulting map scale provided in Table 1.
When we transitioned to the digital imaging sensors, we
were faced with the same challenge of deciding on which
image resolution was suitable to produce a map or ortho
photo with a certain map scale. As we were constrained
by the users’ specifications and understanding, we tried to
create such association, not based on any scientific merit,
but according to what we practiced and learned from our
experience during the transition from film to softcopy. We
developed the association of digital imagery and map scale
given in Table 2, based on what we learned from Table 1.
Table 2 represents how we interpreted the ASPRS legacy
map accuracy standard of 1990 which is originally based on
paper map scales to suite digital imagery. Again, the values
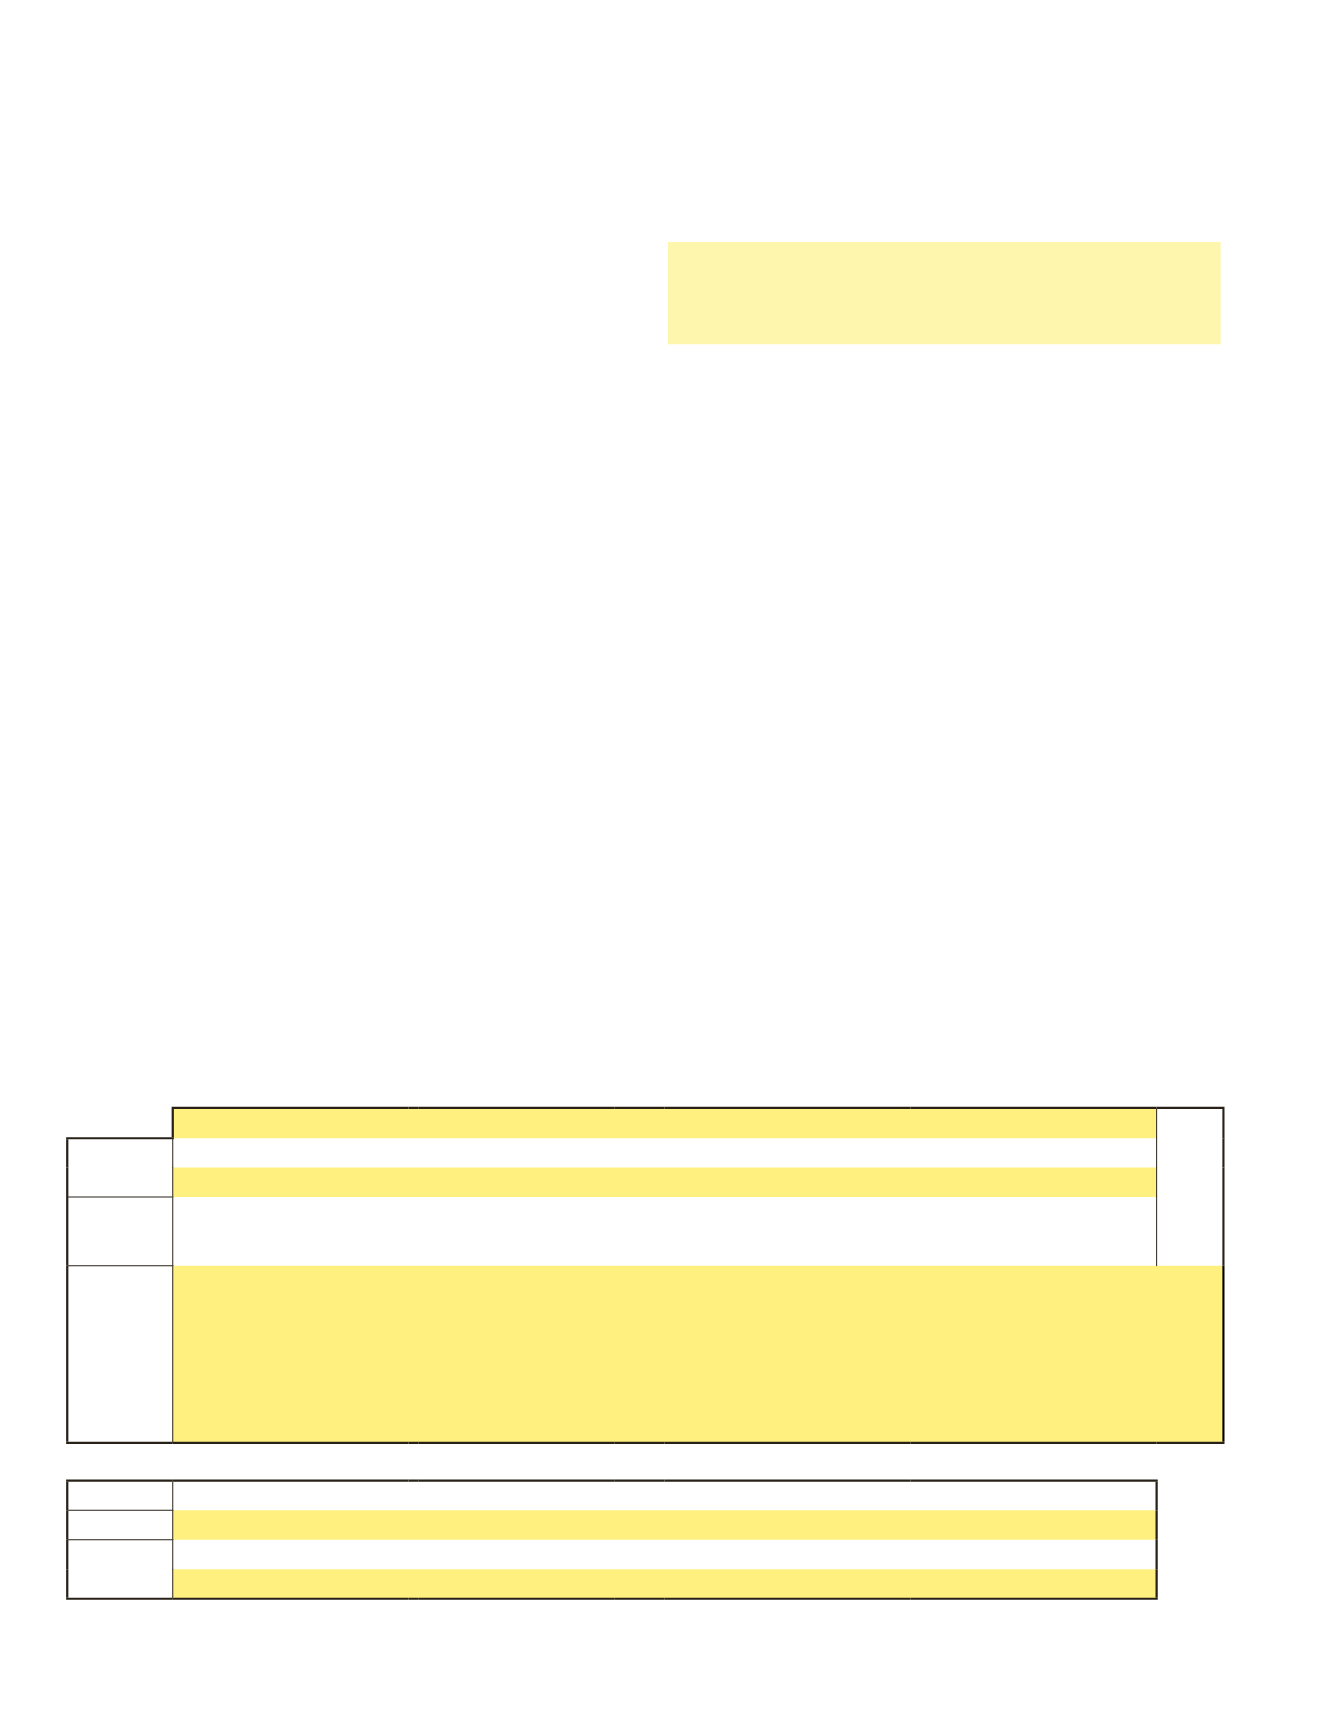
Table 1. Relationship between film scale and derived map scale.
Common Photography Scales (with 9” film format camera and 6” lens)
Scanning Resolution
(um)
Photo
Scale
1” = 300’
1” = 600’
1” = 1200’
1” = 2400’
1:3,600
1:7,200
1:14,400
1:28,800
Flying
Altitude
1,800’ / 550 m
3,600’ / 1,100 m
7,200’ / 2,200 m
14,400’ / 4,400 m
Approximate
Ground Sampling
Distance (GSD) of Scan
0.25’ / 7.5 cm
0.50’ / 0.15 m
1.0’ / 0.3 m
2.0’ / 0.6 m
21
Supported Map/Orthoimagery Scales and Contour Intervals
GSD
3” / 7.5 cm
6” / 15 cm
1.0’ / 30 cm
2.0’ / 60 cm
C.I.
1.0’ / 30 cm
2.0’ / 60 cm
4’ / 1.2 m
8’ / 2.4 m
Map Scale
1” = 50’
1” = 100’
1” = 200’
1” = 400’
1:600
1:1,200
1:2,400
1:4,800
“Digital imagery and lidar produce digital maps and
digital elevation data that are no longer associated
or defined by map scale or contour interval”


