346
May 2015
PHOTOGRAMMETRIC ENGINEERING & REMOTE SENSING
I
ntroduction
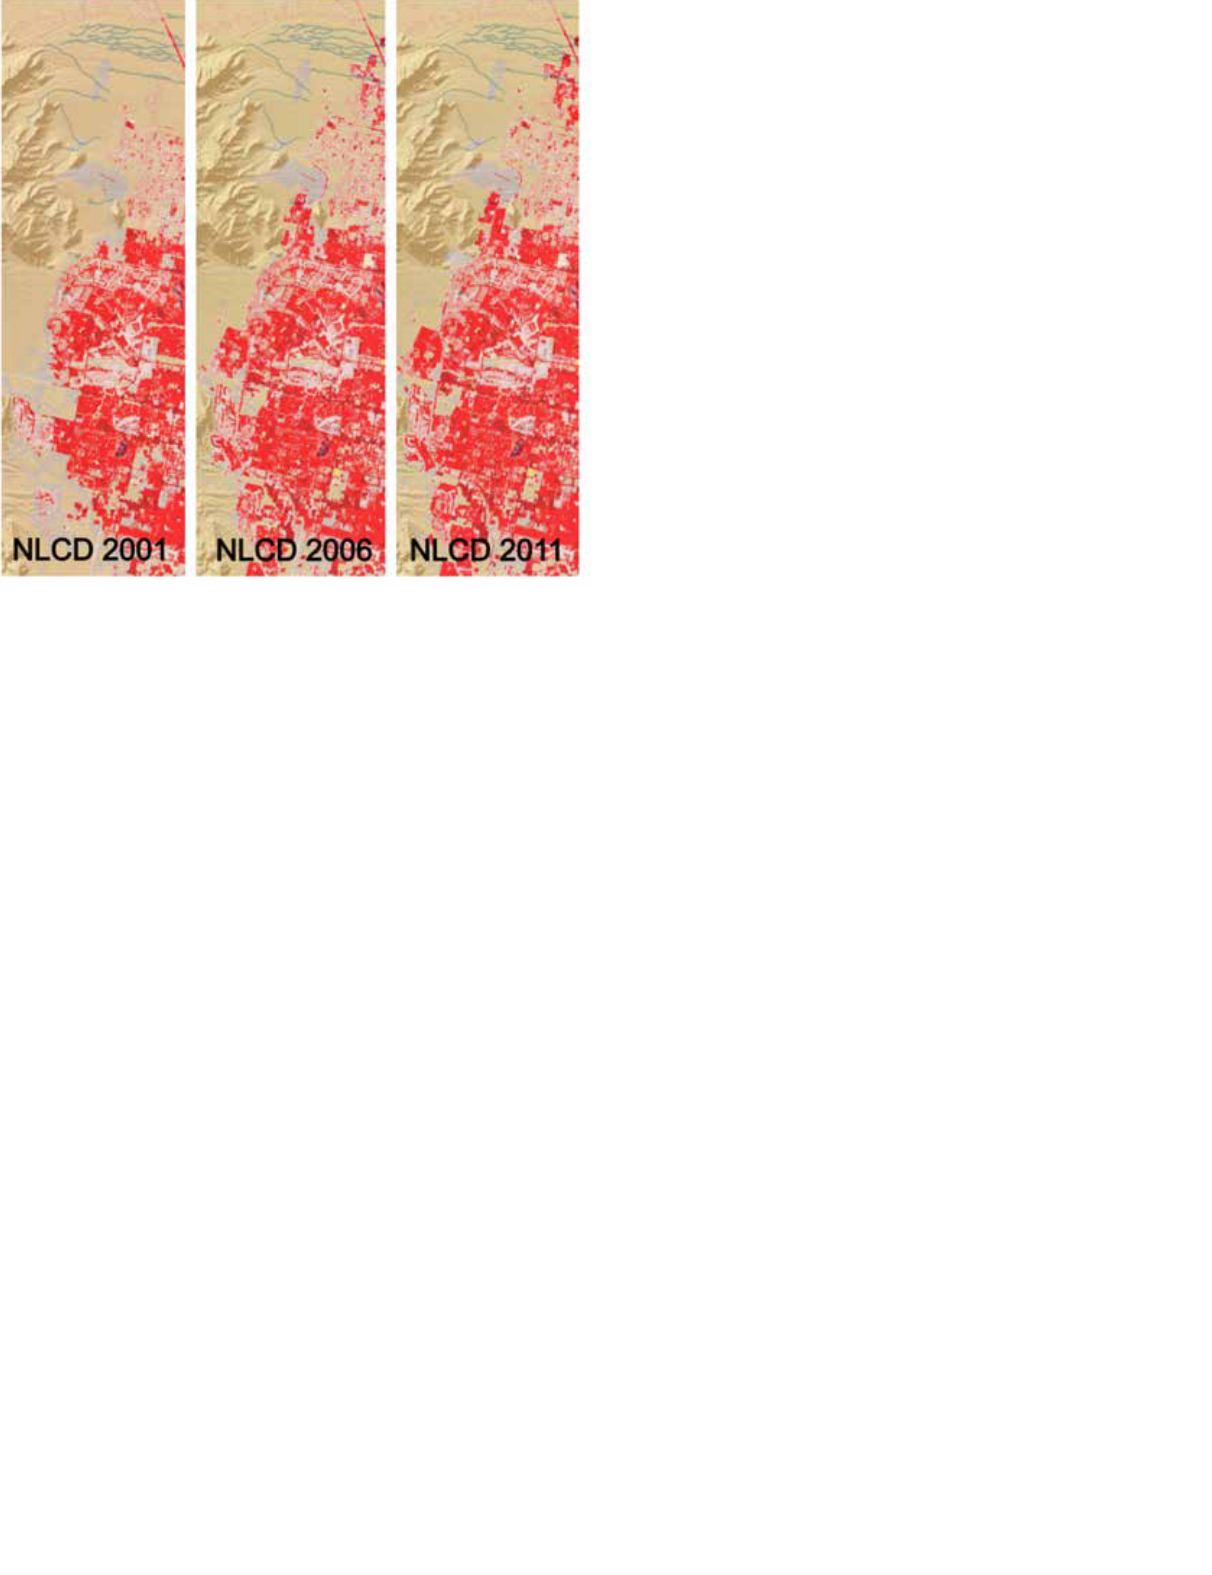
The National Land Cover Database (NLCD) provides nation-
wide data on land cover and land cover change at the native
30-m spatial resolution of the Landsat Thematic Mapper
(TM). The database is designed to provide five-year cyclical
updates of United States land cover and associated changes.
The recent release of NLCD 2011 products now represents a
decade of consistently produced land cover and impervious
surface for the Nation across three periods: 2001, 2006, and
2011 (Homer et al., 2007; Fry et al., 2011). Tree canopy cover
has also been produced for 2011 (Coluston et al., 2012; Colus-
ton et al., 2013). With the release of NLCD 2011, the database
provides the ability to move beyond simple change detection
to monitoring and trend assessments. NLCD 2011 represents
the latest evolution of NLCD products, continuing its focus
on consistency, production, efficiency, and product accuracy.
NLCD products are designed for widespread application in
biology, climate, education, land management, hydrology, en-
vironmental planning, risk and disease analysis, telecommu-
nications and visualization, and are available for no cost at
http:/
. NLCD is produced by a Federal agency
consortium called the Multi-Resolution Land Characteristics
Consortium (MRLC) (Wickham et al., 2014). In the consor-
tium arrangement, the U.S. Geological Survey (USGS) leads
NLCD land cover and imperviousness production for the bulk
of the Nation; the National Oceanic and Atmospheric Ad-
ministration (NOAA) completes NLCD land cover for the con-
terminous U.S. (CONUS) coastal zones;, and the U.S. Forest
Service (USFS) designs and produces the NLCD tree canopy
cover product. Other MRLC partners collaborate through re-
source or data contribution to ensure NLCD products meet
their respective program needs (Wickham et al., 2014).
M
ethods
NLCD 2011 production sought accurate representation of
nominal year 2011 land cover condition and the change occur-
ring between 2006 and 2011 through methods and algorithms
that were scientifically based, quantifiable, scalable, and re-
peatable. Product generation followed identical protocols na-
tionally for consistency and accuracy across both space and
time. Production protocols spanning source data preparation,
spectral change detection, land cover change modeling and
mapping, impervious and canopy generation, and post-pro-
cessing strategies are outlined in the following sections.
S
ource
D
ata
P
reparation
Landsat 5 Thematic Mapper (TM) imagery provided the foun-
dation for spectral change analysis, land cover classification,
and imperviousness modeling for all NLCD 2011 products.
All Landsat images were acquired from the USGS Earth
Resources Observation and Science (EROS) Center Landsat
archive, where they were radiometrically and geometrically
calibrated. All reflective bands were converted from a digi-
tal number to top-of-atmosphere (TOA) reflectance through
the Level 1 Product Generation System (LPGS). Two Landsat
scene pairs were selected for analysis and classification for
each path/row in CONUS for each target year of 2006 and
2011. Image date selection objectives included a leaf-on and
leaf-off scene pair for each path/row with acquisition anniver-
sary dates within two weeks of each other in order to main-
tain as much phenological consistency as possible.
Common image extents for each path/row were defined by
calculating the intersection area of all Landsat images; this
boundary was then subsequently used for clipping all image
and ancillary data for each path/row. Ancillary datasets re-
quired for analysis included NLCD 2001, NLCD 2006, Na-
tional Elevation Dataset (NED) derivatives of slope, aspect,
elevation, and topographic position, USDA Natural Resources
Conservation Service Soil Survey Geographic (SSURGO) da-
tabase Hydric Soils, National Agricultural Statistics Service
(NASS) 2011 Cropland Data Layer (CDL), National Wetlands
Inventory (NWI), and nighttime stable-light satellite imagery
(NSLS) from the NOAA Defense Meteorological Satellite Pro-
gram (DMSP). These ancillary data combined with Landsat
imagery and derivatives were used as independent variables
in the land cover decision tree modeling process. All data
were georegistered to the Albers Equal Area projection grid
and resampled to a 30-m cell resolution.
E
nhanced
S
pectral
C
hange
D
etection
For NLCD 2011, two major change detection advancements
over previous NLCD methods were implemented. First, unlike
NLCD 2006 (Fry et al, 2011), two pairs rather than one pair of
Landsat images between 2006 and 2011 (one leaf-on pair and
one leaf-off pair) were utilized for spectral change analysis. Use
of an additional image pair for land cover change detection re-


