of the canopy structure, the LICOR (2011) and AccuPAR
(Decagon Devices, Inc. 2014) ceptometers. While differences
between sensors have been noted, most comparisons show
suitability of both light recording methods (Norman and
Campbell, 1989). Given fairly comparable outcomes, our
priorities became the operational practicability of measure-
ment in these highly challenging marsh environments and the
ability to maximize the capture of data within a highly vari-
able three-dimension structure while minimizing effort and
disruption of the canopy architecture. In considering these
challenges, we chose the AccuPAR ceptometer with an 80 cm
thin probe to maximize horizontal sampling with minimal
canopy architecture disruption.
The one drawback of the AccuPAR light recording instru-
ment is the necessity to estimate the orientation index in
order to calculate density or
LAI
. While pre-estimation of
orientation in more regularly structure grass and agriculture
canopies is warranted, that reliance on approximation in
these extremely three-dimensionally variable marshes re-
quires validation. In order to provide that validation, canopy
light attenuation as a direct representation of canopy structure
must be parameterized as
KM
and
LAI
.
Objectives
This study describes the calculation of marsh structure vari-
ables from measurements of sunlight transmittance from the
top to bottom of
S. alterniflora
marsh canopies. The structure
indicators were the leaf area index (
LAI
) as the indicator of
canopy density or one-sided leaf layers projected onto a 1 m
horizontal surface and the canopy extinction coefficient
KM
,
or as corrected in this study by the sun zenith angle, the leaf
angle distribution (
LAD
) as the indicator of the canopy overall
leaf and stalk orientation. The objective of this research was
to develop a method based on the light attenuation profiles to
provide site average estimates of the canopy average orien-
tation as
LAD
and site average profiles of canopy density or
LAI
. To reach that objective, we first measured biomass and
PAR
transmittance at seven sites over a three year full growth
period at near anniversary dates. We then implemented and
carried-out a strategy that transformed light transmittance
recordings to
LAD
and
LAI
based on the
LAD
, assessed the
performance of the transformation, and compared literature
values to
LAI
and
LAD
values obtained in this study.
Field Measurements
Data were collected in all seven field sites during summer full
growth from June to July 2010, 2011, and 2012. Data collection
within the 30 m by 30 m plots followed a standard sampling
strategy that provides reproducible measures within these struc-
turally variable marshes (for a detailed description, see Ramsey
et al.
, 2004). The AccuPAR sensor was used to measure the
PAR
(400 to 700 nm) light energy at a 20 cm increment from the bot-
tom to the top of the marsh canopy. Simultaneously, a separate
PAR
sensor calibrated to the profile sensor recorded sunlight
above the canopy. The ratio of above to profile light record-
ings produced the fraction of above
PAR
reaching progressively
deeper into the canopy. These vertical profiles of light falloff
were obtained at 3 m increments along the 30 m east/west and
north/south transects producing 22 profiles per site per year.
Postprocessing aggregated the produced 22 individual profiles
into an average site profile comprised of the mean ±standard
deviation calculated for each 20 cm profile depth. The site aver-
aged profiles were used in all subsequent calculations.
Biomass was measured by clipping (a few centimeters
above the surface) and gathering all standing marsh within a
1 m
2
area chosen to represent the typical marsh at each site.
Biomass samples were separated into live and dead portions,
dried, and weighed (for method details see Ramsey and Ran-
goonwala, 2005).
Biomass and Bottom
PAR
Biomass is often estimated from a single measurement at the
top and bottom of the grassland canopy. This method was
reported to produce functional relationships between the bot-
tom
PAR
recording normalized by the top of canopy recording
and measured biomass in gulf coast marshes (Whitbeck and
Grace, 2006). As contended here, that result would suggest fair
uniformity in canopy structure from site to site. In order to test
our contention, we constructed the same relationship with data
collected in the
S. alterniflora
marsh sites used in this study.
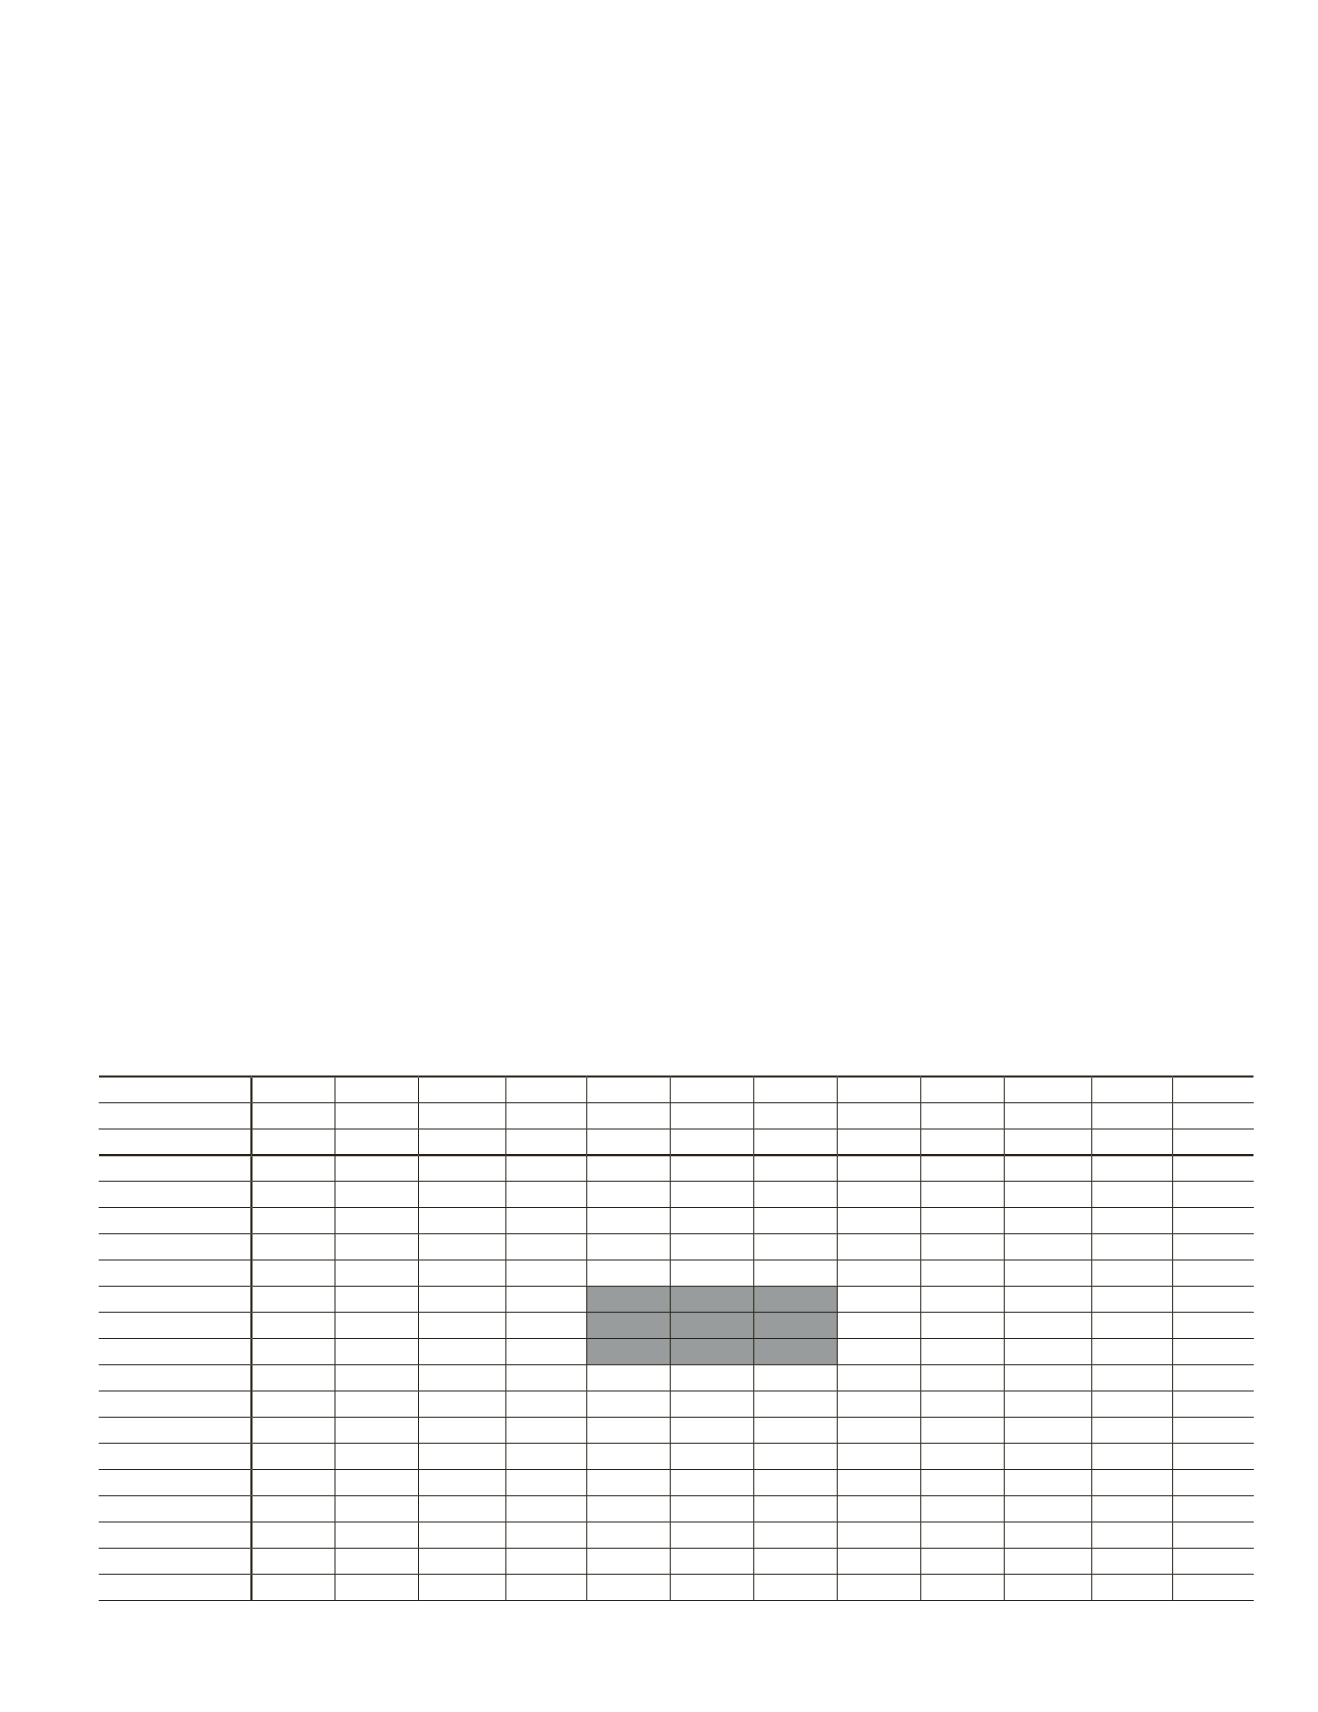
T
able
1. B
iophysical
M
easurements
and
S
tructure
V
ariables
(RF = R
ockefeller
R
efuge
, BA = B
arataria
B
ay
, GM = G
olden
M
eadows
, LV = L
ive
, DD = D
ead
, TOT-B
io
= T
otal
B
iomass
,
PAR = P
hotosynthetically
A
ctive
R
adiation
, KM = E
xtinction
C
oefficient
, LAI = L
eaf
A
rea
I
ndex
, LAD = L
eaf
A
rea
D
istribution
(KM*
cos
(S
un
Z
enith
)).
LV-Bio DD-Bio TOT-Bio LV/DD Water Water Water Bottom KMLAI LADLAI
KM LAD
Site-Year
LV-Bio DD-Tot Tot-Bio PAR
gr/m
2
gr/m
2
gr/m
2
gr/m
2
gr/m
2
gr/m
2
gr/m
2
m
2
/m
2
m
2
/m
2
RF3-10
795.0 622.1 1417.1 1.28 1792.8 1445.1 3238.0 0.07
2.72
2.75
0.90 0.88
RF3-11
173.0 219.3 392.3 0.79 234.4 112.3 346.6 0.17
2.57
2.60
0.70 0.69
RF4-11
179.5 364.0 543.4 0.49 284.0 201.8 485.8 0.17
2.23
2.41
0.80 0.72
RF3-12
673.6 576.2 1249.8 1.17 814.4 475.4 1289.8 0.19
2.32
2.39
0.70 0.67
RF4-12
372.5 334.3 706.8 1.11 484.9 400.7 885.6 0.16
1.88
2.15
1.10 0.82
BA25-11
191.6 328.7 520.3 0.58
0.04
4.51
5.03
0.60 0.50
BA27-11
334.9 505.1 839.9 0.66
0.09
3.07
3.15
0.80 0.78
BA33-11
229.0 452.4 681.4 0.51
0.21
3.40
3.46
0.40 0.39
BA25-12
555.8 581.9 1137.7 0.96 1297.0 2337.6 3634.6 0.16
2.81
3.92
0.50 0.31
BA27-12
1095.1 1256.0 2351.1 0.87 2045.0 2372.6 4417.5 0.06
4.20
4.34
0.60 0.58
BA33-12
429.8 142.1 571.9 3.03 1590.9 817.3 2408.2 0.47
1.09
1.24
0.50 0.38
GM397-10
801.2 743.9 1545.1 1.08 382.5 290.7 673.2 0.00
4.76
4.94
1.10 1.04
GM978-10
760.9 737.6 1498.5 1.03 2297.1 1965.8 4262.9 0.16
4.13
4.44
0.60 0.52
GM397-11
189.7 339.6 529.3 0.56 290.3 336.5 626.8 0.09
3.25
3.28
0.60 0.59
GM978-11
7.1
464.1 471.2 0.02 14.2 392.4 406.6 0.11
3.07
3.17
0.70 0.67
GM397-12
644.8 418.4 1063.3 1.54 305.1 393.1 698.3 0.09
3.64
4.13
0.50 0.40
GM978A-12 579.8 508.6 1088.4 1.14 285.4 574.2 859.7 0.14
2.64
3.26
0.60 0.39
PHOTOGRAMMETRIC ENGINEERING & REMOTE SENSING
October 2015
809


