2014), no similar pattern of biomass and composition changes
were clearly exhibited per region or across all sites. Even with
knowledge of that dieback, when the dataset is examined col-
lectively, there is no noticeably pattern of grouping per region
or year. The
S. alterniflora
marsh biophysical features were
highly transitory and variable at the site level. In both biomass
quantity and composition, the spatial and temporal variabil-
ity produced broad and well distributed dataset ranges well
suited for accomplishing our objectives.
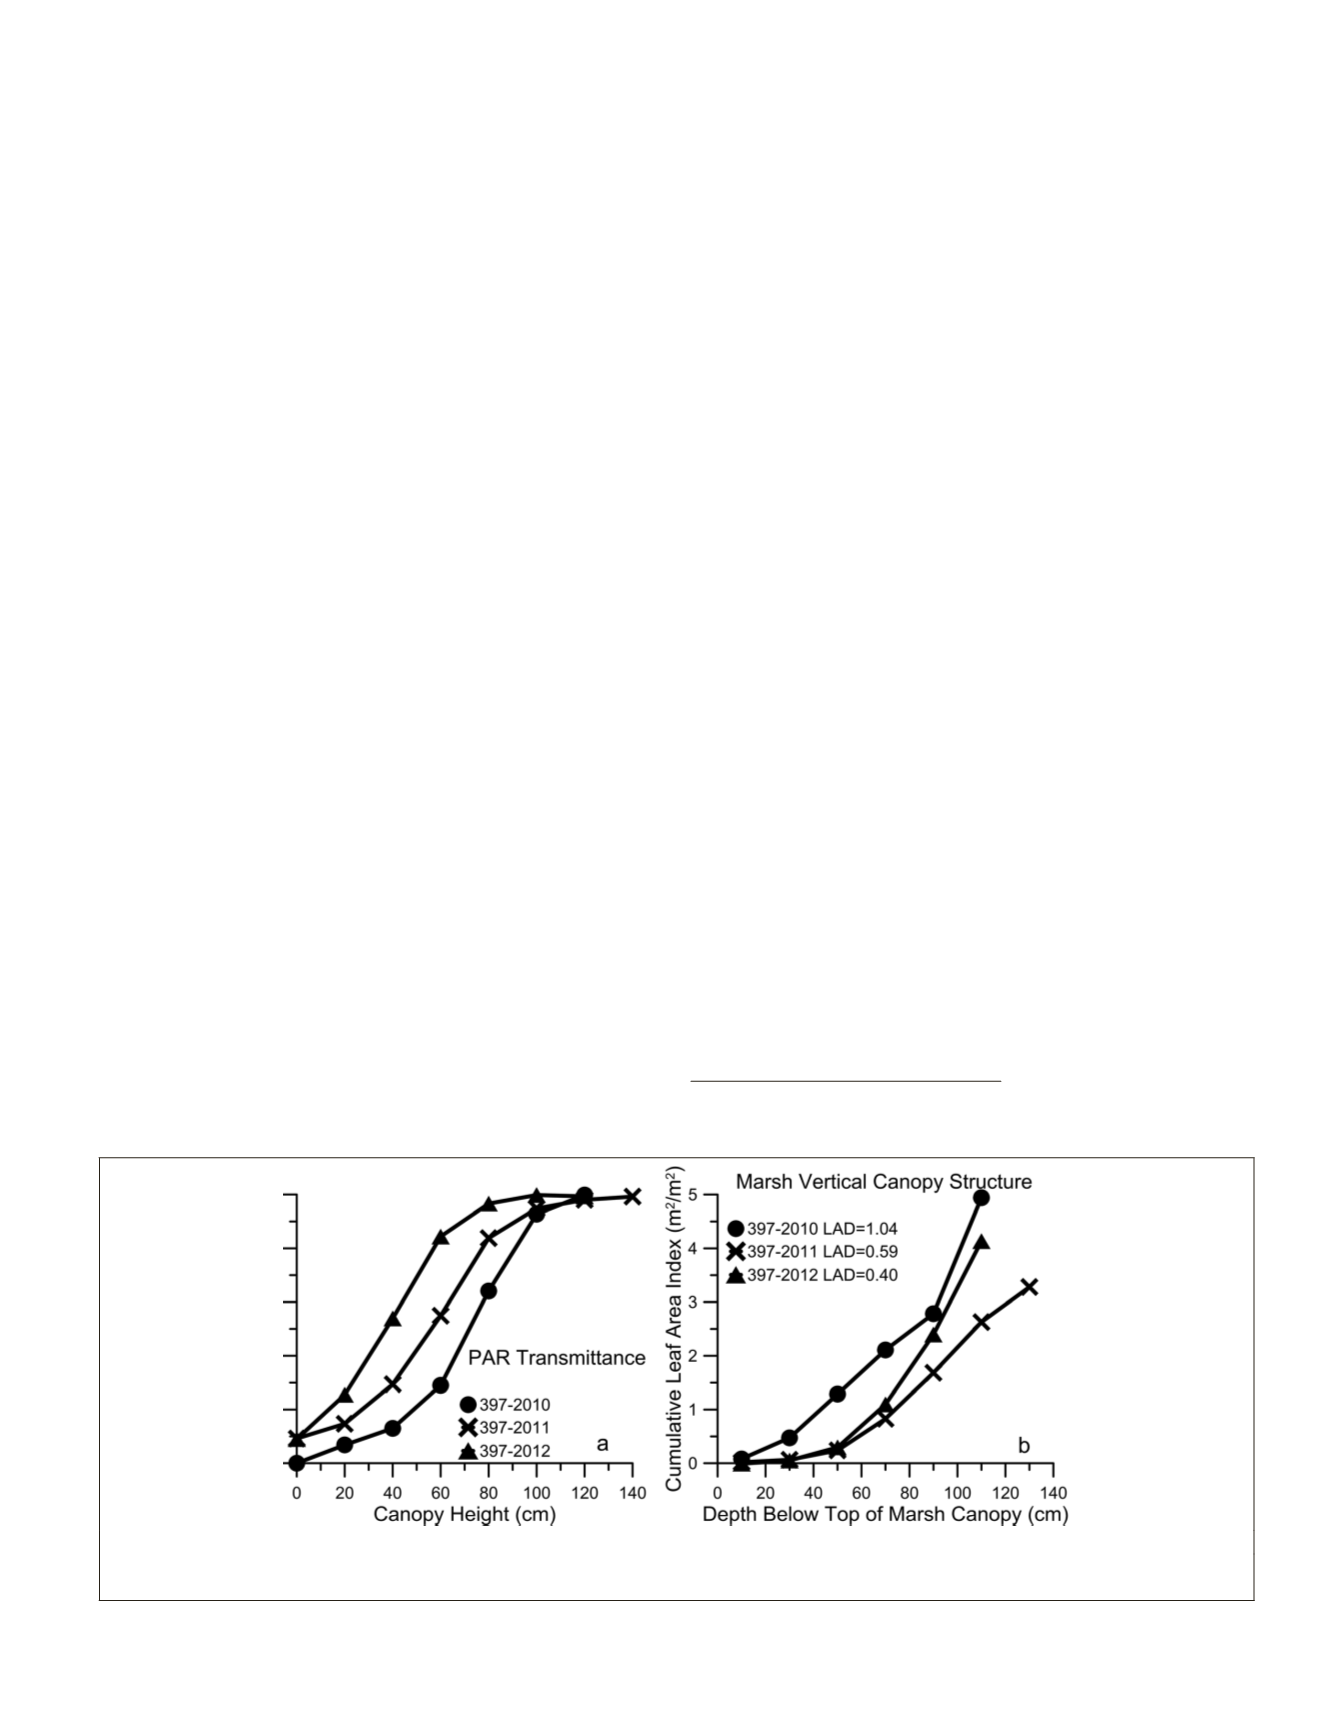
PAR
measurements averaged per profile depths were calcu-
lated for each site over the three-year period. As an example;
PAR
profiles of the site 397 Golden Meadow marsh that under-
went a dieback event from 2010 to 2012 is included as Figure
2a. The yearly
PAR
profiles illustrate a healthy and dense
marsh canopy in 2010 transformed to a less dense (loss of
biomass, particularly live biomass) marsh canopy at the apex
of the dieback event. By the 2012 recovery, canopy biomass,
especially live biomass, has increased, however
PAR
transmit-
tance is higher than that in 2010 or 2011.
Biomass and Bottom PAR
A significant relationship (
p
<0.05) did not exist between the
total wet or dry biomass and bottom
PAR
measurements (Figure
3). The lack of relationship underscored the observed struc-
tural complexity of these marshes and the need to describe the
marsh canopy more in terms of leaf and stem material and ori-
entation than bulk biomass. This result also indicates the need
for greater canopy detail as represented in the
LAI
profiles.
Light Attenuation Parameterized as LAI and LAD
PAR
profiles were parameterized as
LAI
profiles and average
LAD
orientations for each site and year. To illustrate the transforma-
tion,
PAR
profiles depicted in Figure 2a are shown as
LAI
pro-
files with the associated average
LAD
listed (Figure 2b). The
LAI
plots clearly depict the biomass vertical structure and explain
how the both
PAR
transmittance and biomass increased from
2011 to 2012. First, the 2010
LAI
profile represents a dense
canopy that becomes abruptly denser at 20 cm above the marsh
ground surface. The
LAD
(1.04) defines a highly horizontal
orientation. By 2011, lodging present in the 2010 bottom 20-cm
of the marsh is gone. Above the 20 cm level, the 2010 to 2011
density decrease was fairly proportional. The loss of lodging
and overall biomass decrease transforms the canopy to a more
mixed orientation (
LAD
= 0.59). From 2011 to 2012 there is an
increase in total biomass, dominantly live biomass (Table 1) in-
dicating regrowth. The
LAI
profile correctly portrays the higher
biomass density in 2012 as compared to 2011. The reason for
the higher transmittance is also explained because the new
growth is highly vertical (
LAD
= 0.4) providing the increased
PAR
transmittance illustrated in Figure 2a. The
LAI
and
LAD
representation of the canopy structure removed the seeming
contradiction of increased biomass increasing transmittance.
Adjustments to Standard Methods Tested
Differences in results using the original form of Equation 2
to calculate cumulative
LAI
values and the differential form
(Equation 4) used here were moderate. Correspondence of
LAI
using the two approaches was moderately high (R
2
= 0.76,
n
=
17), however, the differential form stabilized the calculation
where changes in
PAR
were abnormally abrupt, particularly
where canopy lodging existed (such as at site 397 in 2010).
The differential approach reduced the emphasis on these
uncommon abrupt changes resulting in an overall better fit to
the entire canopy profile.
Assessing the Light Attenuation Parameterization
The most important criteria in assessing performance of the
methods employed here was the ability of the calculated
structure variables to represent the measured site-averaged
light attenuation profiles. This was accomplished by direct
comparison of predicted values to measured values. The pre-
dicted site averaged cumulative
PAR
transmittance normalized
by the above canopy
PAR
was calculated at each 20 cm profile
level for all sites. The
PAR
transmittance with canopy depth
calculation was based on Equation 5.
PAR
(
z
) =
EXP
(–
KM
*
LAI
)
(5)
KM
values were used in order to conform to conditions at
the time of measurement. The
KM
and the associated
KM
-
LAI
values were based on Equation 4 adjusted to
LAI
increments.
The correspondence between the measured and predicted
PAR
normalized incremental changes was high (R
2
= 0.987,
n
=
105) with a slope of 0.987 ± 0.0110 (±standard error) (1.016 [Up-
per] and 0.958 [Lower] Bounds), bias of -0.015 ±0.0079 (0.0061
[Upper] and -0.035 [Lower] Bounds) and a root-mean-square-
error (
RMSE
) of 0.039 (Figure 4). At a 95 percent probability,
the slope does not differ from one, the bias from zero, and
PAR
based on the derived
KM
and
LAI
is correct within 0.039. These
results confirm that the method employed to calculate structure
parameters adequately represents the actual marsh structure as
captured by the field measured light profiles at each site.
LAI based on Optimized and Constant LAD
The
LAI
values based on optimized
LAD
values were then
compared to
LAI
values based on a constant
LAD
at all sites.
(a) (b)
Figure 2. (a) Site-averaged PAR measurements encapsulating the onset and recovery of a
S
.
alterniflora
marsh dieback event, and (b) The
PAR measurements shown in (a) parameterized as LAI and LAD canopy structure indicators.
PHOTOGRAMMETRIC ENGINEERING & REMOTE SENSING
October 2015
811


