460
July 2016
PHOTOGRAMMETRIC ENGINEERING & REMOTE SENSING
Figure 6. Higher resolution SPL DEM (top) and shaded DEM (bottom) at a resolution of 0.5 m (left), 0.25 m (middle) and 0.1 m (right) over the
Forest area.
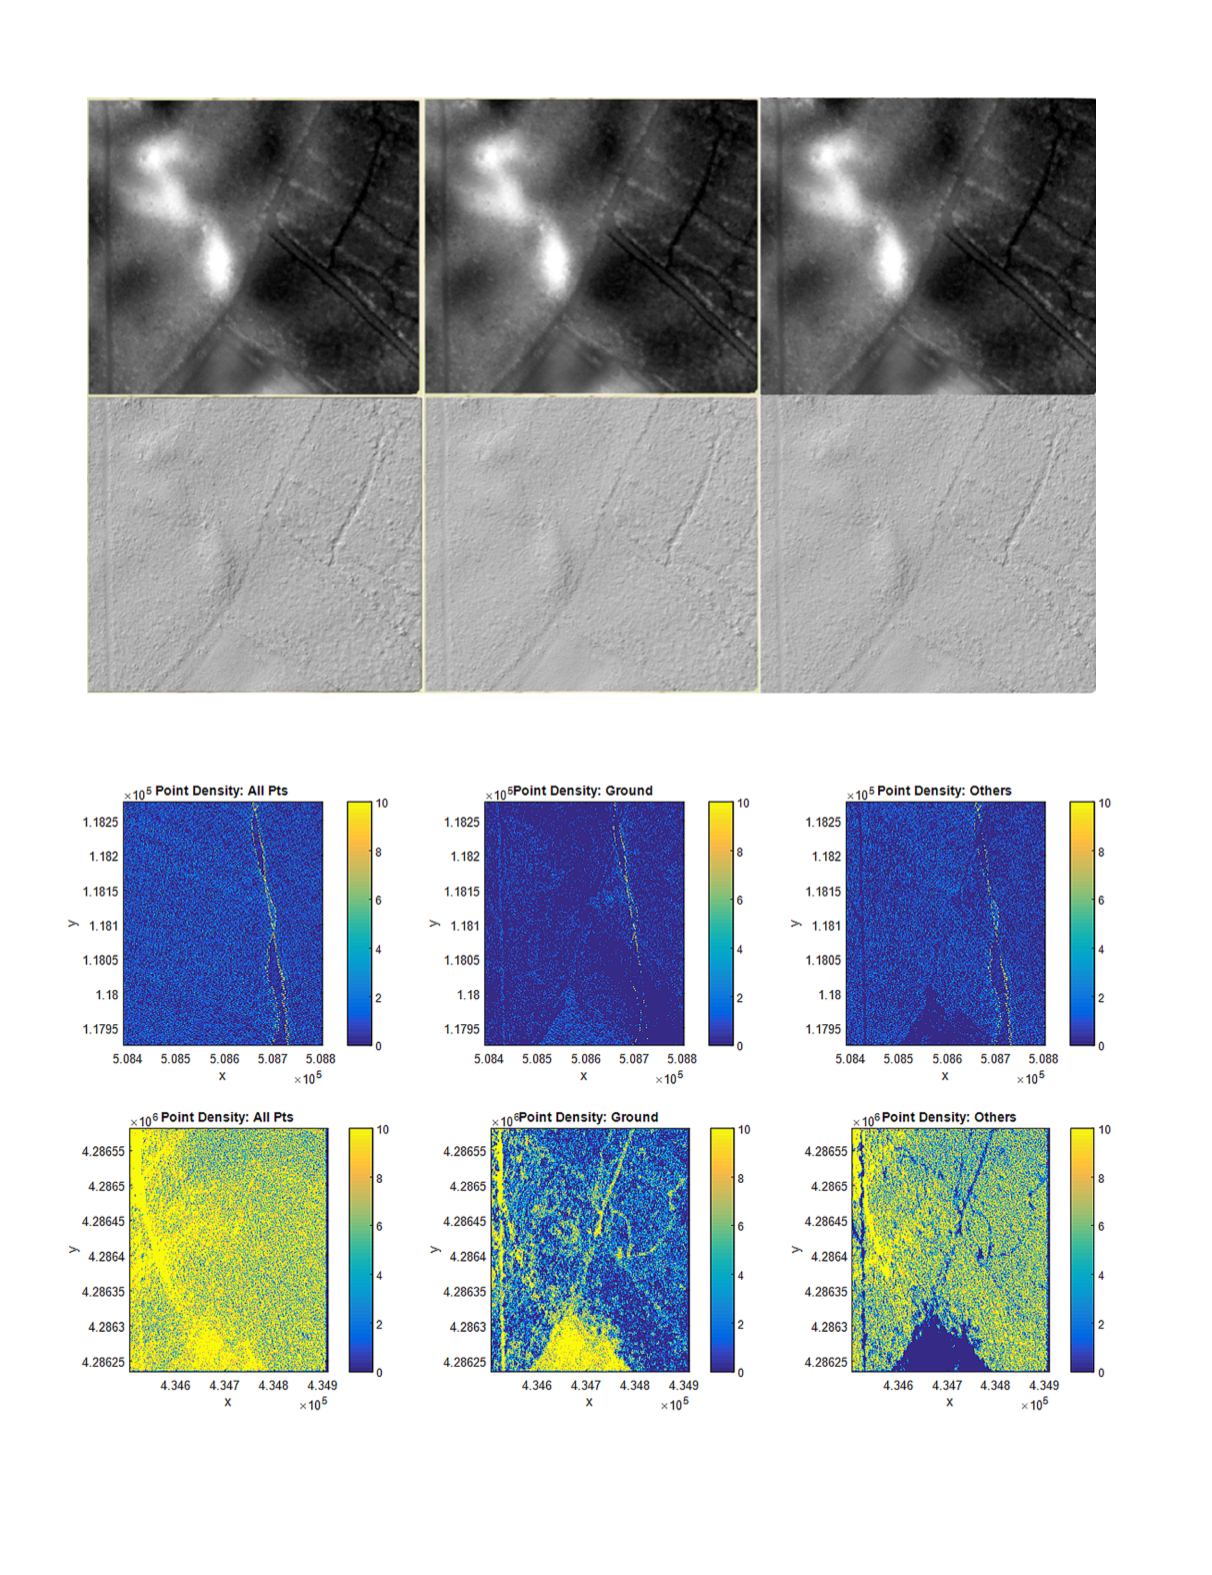
Figure 7. Distribution of point density of the linear lidar (top) and the SPL (bottom). The three columns are the density (#points/sq. meter) of all
points (left), ground points (middle) and non-ground points (right).


