470
July 2019
PHOTOGRAMMETRIC ENGINEERING & REMOTE SENSING
helpful in evaluating the seamline mismatch quality of the
final product, i.e. ortho mosaic. The latest image processing
software, such as Pix4D, enables users to visit the mosaic
cut lines and allow them to correct or re-route the mosaic
cut lines in real time. Once a mismatch is found, it can be
quantified and evaluated according to the “ASPRS Positional
Accuracy Standards for Digital Geospatial Data,” as illus-
trated in the far-right column of Table 1.
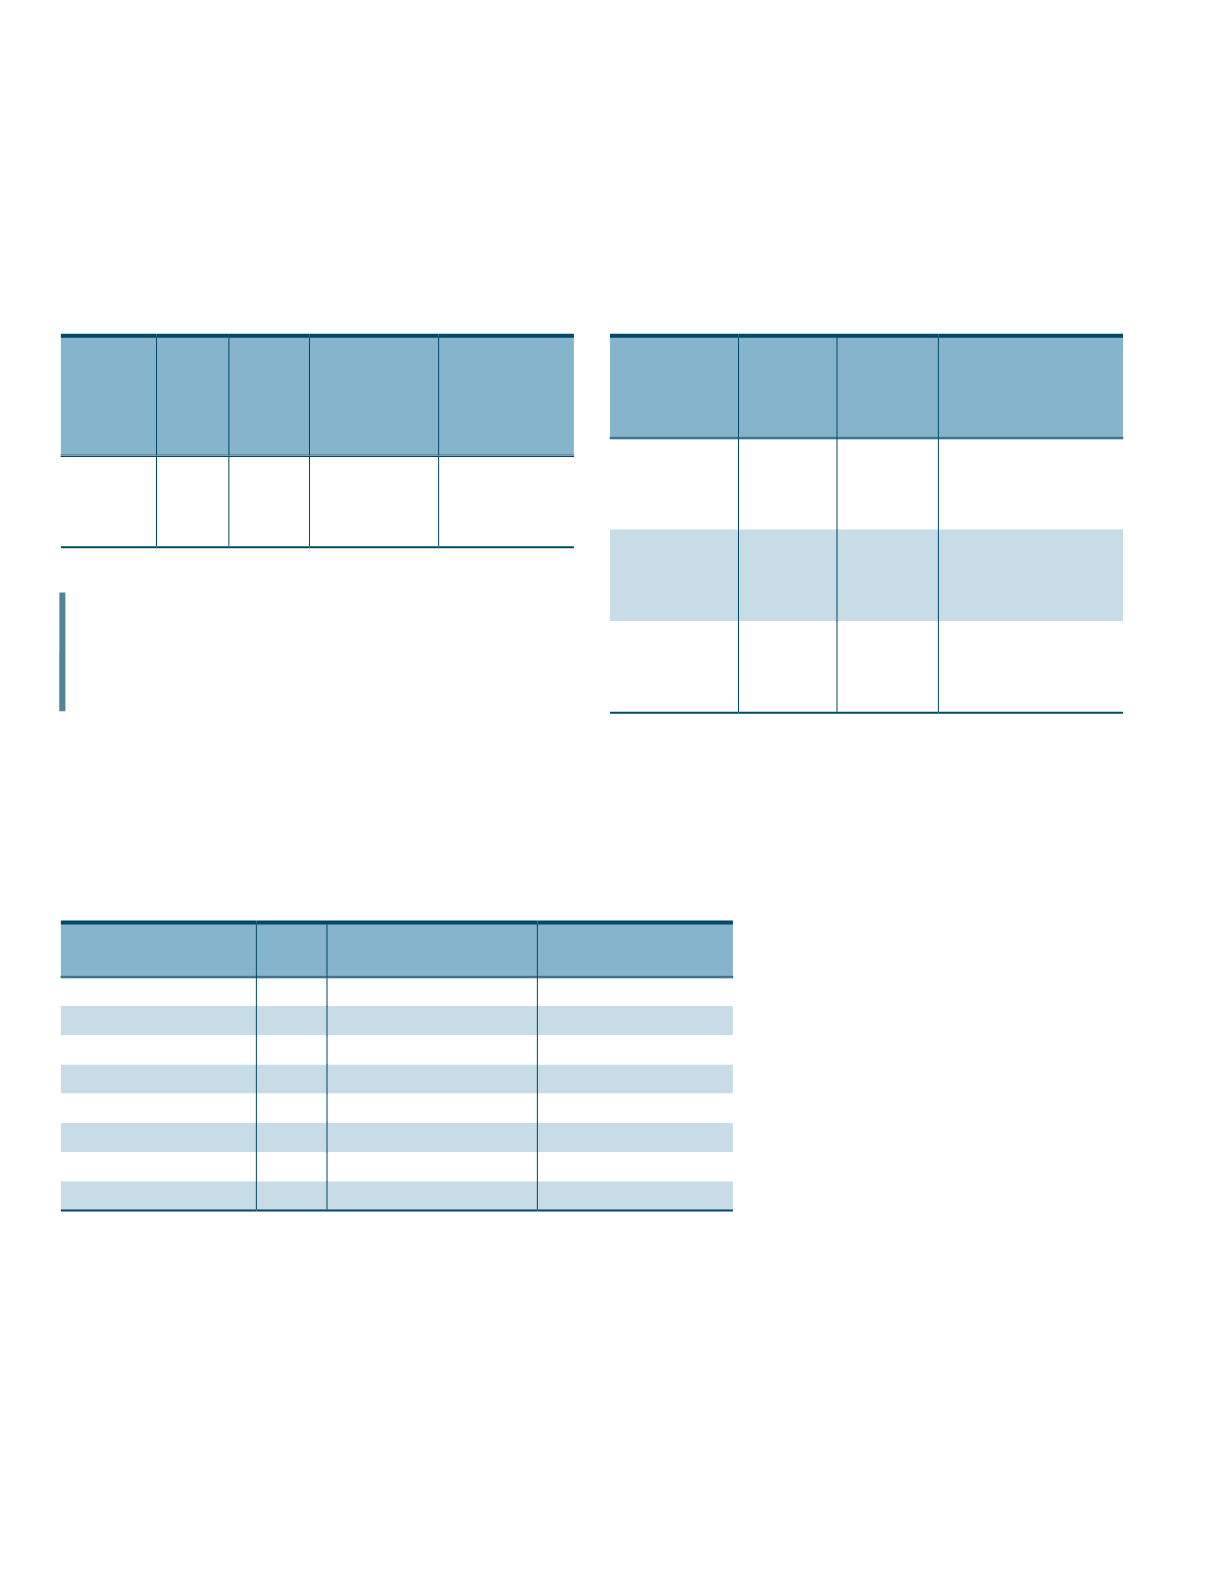
Table 1: ASPRS horizontal accuracy standards and mosaic seamline mismatch.
Horizontal
Accuracy
Class
RMSE
x
and
RMSE
y
(cm)
RMSEr
(cm)
Horizontal
Accuracy at
95% Confidence
Level (cm)
Orthoimagery
Mosaic Seamline
Mismatch (cm)
X-cm ≤X ≤1.41*X
≤2.45*X
≤2*X
Question 9—
If an orthophoto fails a column in Table
B.3 (of the ASPRS Standards, see below) (e.g. the RMS-
E
r
is OK, but the accuracy at 95% CI exceeds the limit),
do you select the accuracy class in which your project
meets or exceeds all standards in a single row?
Table B.3 Common Horizontal Accuracy Classes According to the New Standard.
Horizontal Accuracy Class
RMSEx and RMSEy(cm)
RMSEr
(cm)
Orthoimage Mosaic Seamline
Maximum Mismatch (cm)
Horizontal Accuracy at the
95% Confidence Level (cm)
0.63
0.9
1.3
1.5
1.25
1.8
2.5
3.1
2.50
3.5
5.0
6.1
5.00
7.1
10.0
12.2
7.50
10.6
15.0
18.4
10.00
14.1
20.0
24.5
12.50
17.7
25.0
30.6
…..
…..
…..
…..
Answer:
There is never a situation in which some values
of statistical terms meet the given thresholds while other
terms fail to meet those thresholds for a given accuracy
class. The derived thresholds for RMSEr and the accuracy at
95% confidence level are all derived using the accuracy class
or the RMSE x or y, therefore if the verified RMSE x or y of
the product is found to be outside the specified limit, then
both RMSEr and the accuracy at 95% should fail to meet the
project specifications. Table 2 illustrates two situations of
product accuracy verification for a product accuracy class of
10 cm. In CASE 1, the RMSE x or y of 8 cm meets the project
specifications; in CASE 2, with RMSE x or y of 13 cm, it fails
to meet project specifications. As you notice from the exam-
ple, once the RMSE x or y value meets the threshold, all
other statistical measures derived from that RMSE meet its
thresholds. In the same token, once the RMSE x or y value
fails the threshold, all statistical measures fail as well.
Table 2: Horizontal Accuracy Examples.
Horizontal
Accuracy Class
RMSE
x
and
RMSE
y
(cm)
RMSEr (cm)
Horizontal Accuracy at
95% Confidence Level
(cm)
10 cm
(specification)
≤10
≤14.1
≤24.5
CASE 1
(actual)
8.0 ≤10
(pass)
11.28 ≤14.1
(pass)
19.6 ≤24.5 (pass)
CASE 2
(actual)
13.0 ≥10
(fail)
18.33 ≥14.1
(fail)
31.85 ≥24.5 (fail)
Question 10—
I note that many drone-based surveys
seem to have a mean error much higher than 25% of
the RMSE. What does this information tell you about
the quality of the project, and how can you correct it?
Answer:
The ASPRS standards states that the exact spec-
ification of an acceptable value for mean error may vary by
project and should be negotiated between
the data provider and the client. It also
recommends that the mean error be less
than 25% of the specified RMSE value for
the project. Mean errors that are greater
than 25% of the target RMSE, should be
investigated to determine the cause of the
errors and to determine what actions, if
any, should be taken. Higher value for the
mean errors in general indicates biases in
the data, especially if the computed stan-
dard deviation is low. Biases in the data
can be modeled and removed. Examples of
such biases in the geospatial products are
generated by errors, which can be caused by using the wrong
vertical or horizontal datum or if the surveyor forgot to
subtract the instrument height when adjusting the network
during the ground control surveying or other systematic
errors. If the computed standard deviation is low, you can
always subtract or add the value of the mean (or average)
from the biased quantities to remove the systematic errors,
and this will improve the data accuracy.
“There is never a situation in which some values
of statistical terms meet the given thresholds
while other terms fail to meet those thresholds
for a given accuracy class.”


