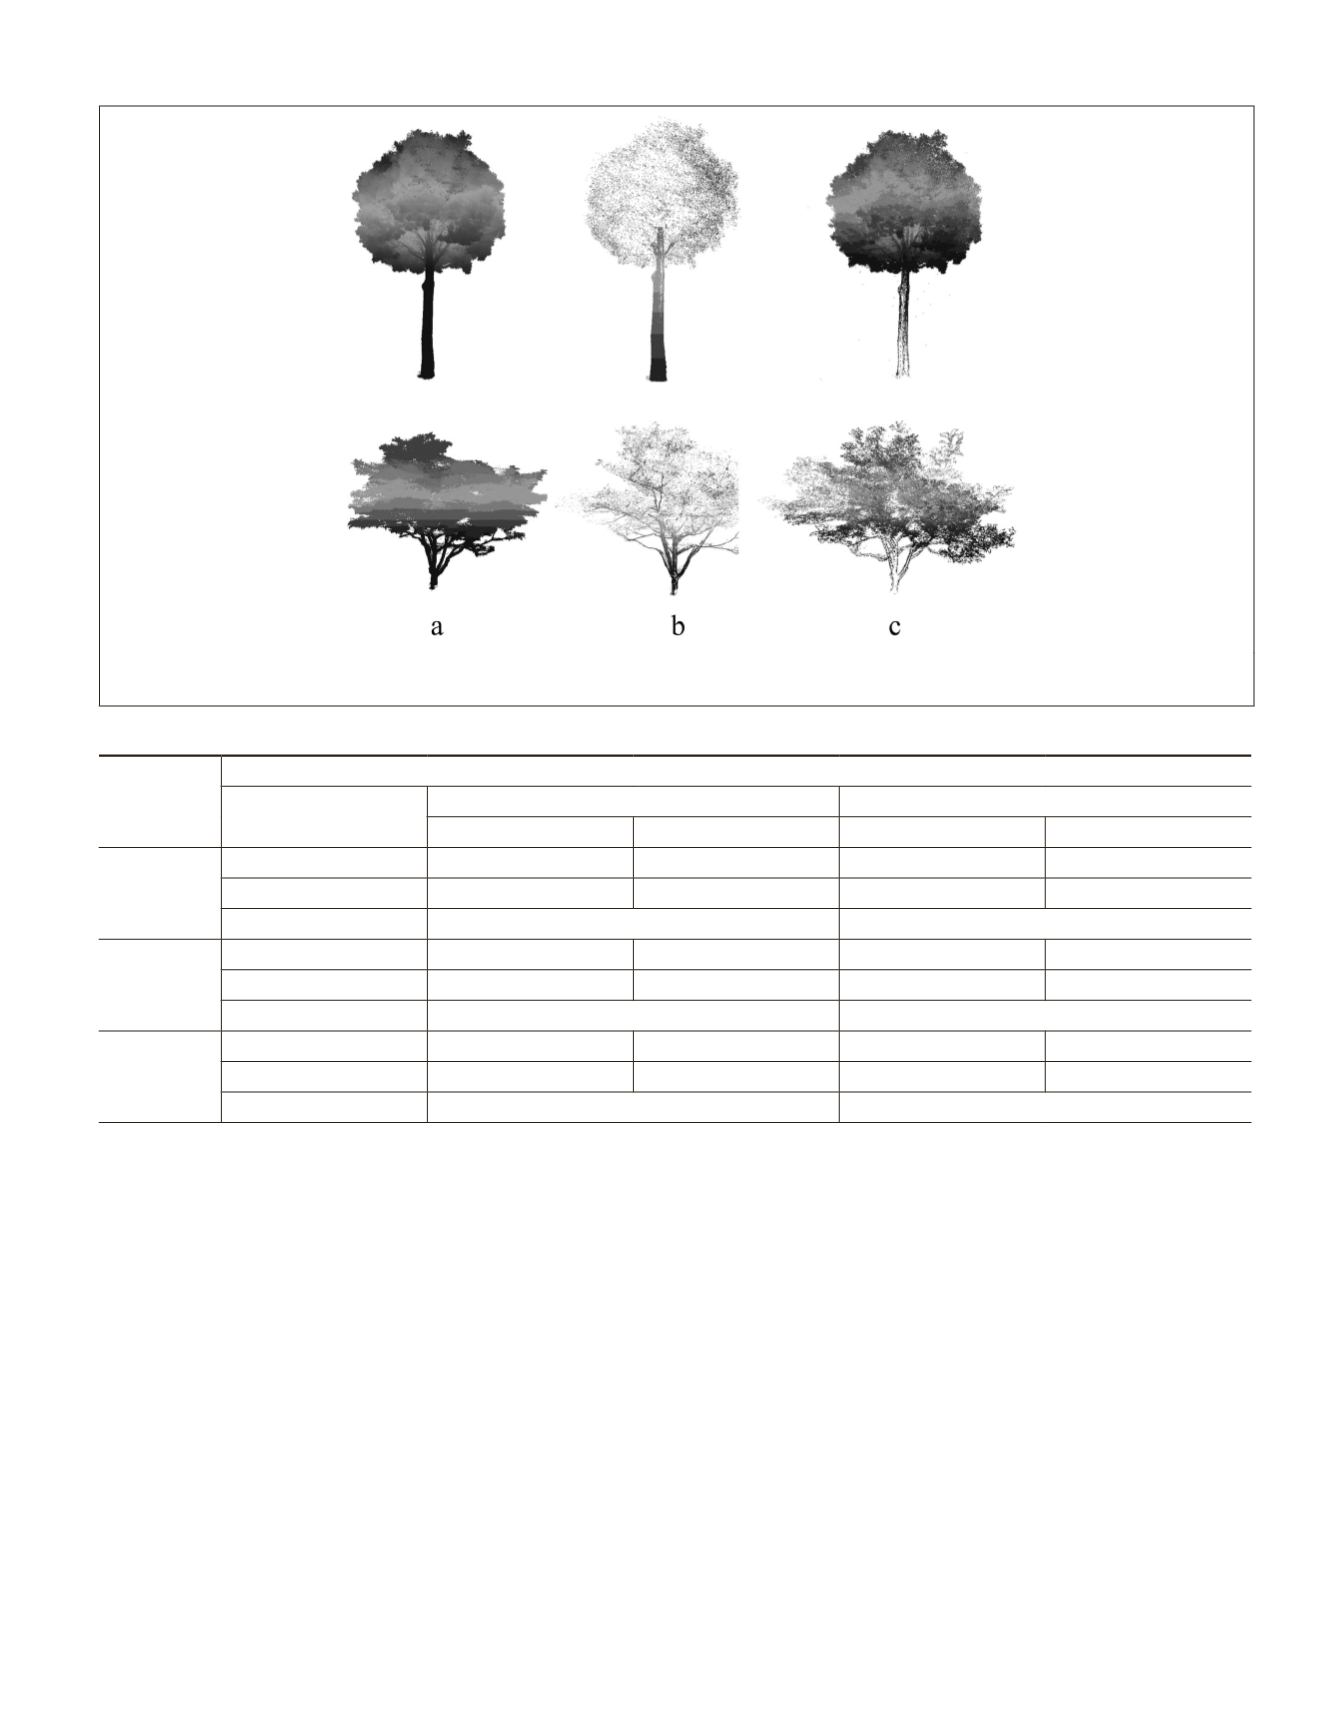
Figure 7. Results of wood-leaf separation using the intensity approach for camphor tree (first row) and magnolia tree (second row): (a) raw
point clouds, (b) wood points, and (c) leaf points.
T
able
2. C
onfusion
M
atrix
and
C
ohen
’
s
K
appa
C
oefficients
of
T
wo
W
ood
-L
eaf
S
eparation
A
pproaches
Reference
Prediction
Geometric method
Intensity approach
Wood points
Leaf points
Wood points
Leaf points
Virtual tree
Wood points
378,658
25,753
/
/
Leaf points
45,525
1,573,773
/
/
Kappa
0.89
/
Magnolia tree
Wood points
300,277
70,127
125,793
9,267
Leaf points
61 000
2 213 064
64 897
565 946
Kappa
0.79
0.71
Camphor tree
Wood points
339,219
100,267
101,930
5,365
Leaf points
52,345
3,963,146
60,547
1,957,698
Kappa
0.80
0.73
was no clear dividing line between the intensity values of the
leaf and wood parts, therefore the accuracy of the intensity
approach was unsatisfactory, as shown in Figures 7, 8, and
9; many leaf points were classified as wood points and vice
versa. Further manual processing was used in previous re-
search to obtain better wood-leaf separation after performing
intensity thresholding (Cote
et al
., 2009).
Most lines were detected at the leaf part of the tree, but
a few were detected at the wood part where branches were
insufficiently scanned or grew horizontally. For these branch-
es, the horizontal slicing in the first step generated irregular
2D distributions of points that were far from circular. These
points can be classified as lines that bridge vertically adjacent
skeleton wood points. Omitting these points affects the estab-
lishment of a graph in the subsequent step, possibly result-
ing in more wood points being misclassified as leaf points.
Another method for detecting horizontally growing branches
is to slice the tree vertically after horizontal slicing. This was
not performed in the current research, because of the compu-
tational burden.
The geometric method involves two key parameters: the
area of the triangle for filtering noise points and the minimum
size defining a circle (i.e.,
T
in Step 4). The former parameter
can first be roughly determined from the distance between
the lidar system and the objective tree, and then finely tuned
manually. The camphor and magnolia trees were both scanned
using a Riegl VZ 400 instrument at a distance of around 5 m,
so we used the same parameter for noise filtering for these two
trees. For the latter parameter, theoretically, an ideal threshold
should indicate the radius of a petiole, which represents the
transition between the stem and the leaf blade. However, in
practice, the threshold was set at the radius of a small branch.
The T-lidar system failed to record the shapes of petioles and
twigs hidden in leaf clusters, because of the combined effects
of instrument sensitivity, scanning resolution, and biophysical
environmental factors such as wind. A large threshold leads
to misclassification of small branch and twig points as leaf
points, whereas a small value can result in the misclassifica-
tion of leaf points as wood points. In order to ensure success-
ful extraction of the main trunk and branches, we set this
PHOTOGRAMMETRIC ENGINEERING & REMOTE SENSING
October 2015
773


