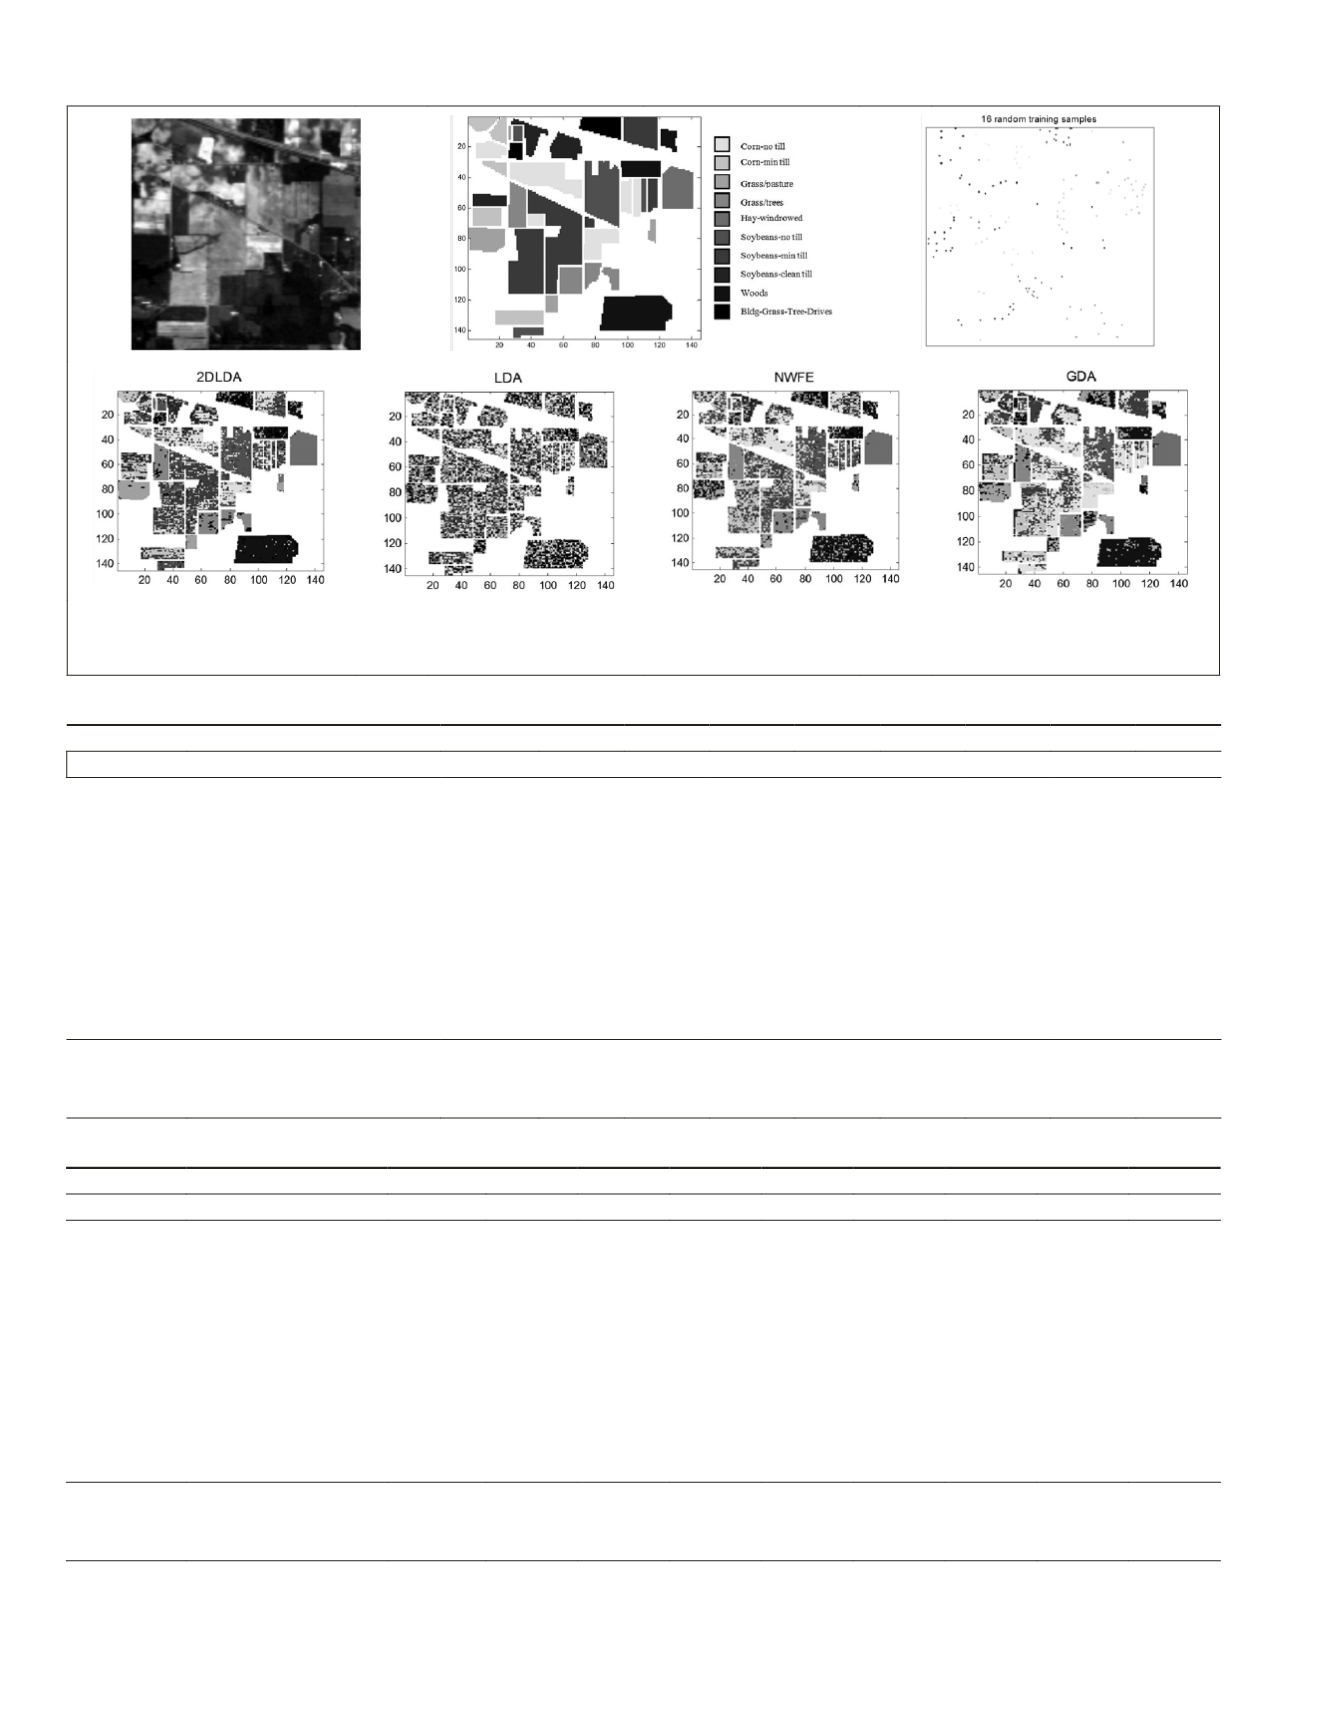
Figure 4. The first row: overview of the Indian area, from left to right: Pseudo-color image, reference data map, and a random training set
(16 training samples per class are shown). The second row: the classification maps of the Indian dataset obtained by the SVM classifier,
16 training samples, and 9 features.
T
able
3. T
he
R
esults
of
C
lassification
A
ccuracy
O
btained
by
the
ML C
lassifier
, 16 T
raining
S
amples
,
and
E
ight
F
eatures
for
the
I
ndian
D
ataset
class
2DLDA
LDA
NWFE
GDA
No. of classes
Name of class
# samples Acc.
Rel.
Acc.
Rel.
Acc.
Rel.
Acc.
Rel.
1
Corn-no till
1434
0.65
0.56
0.09
0.19
0.44
0.50
0.45
0.47
2
Corn-min till
834
0.62
0.45
0.23
0.10
0.47
0.38
0.48
0.40
3
Grass/pasture
497
0.72
0.74
0.10
0.17
0.54
0.72
0.56
0.81
4
Grass/trees
747
0.65
0.85
0.03
0.29
0.74
0.95
0.73
0.89
5
Hay-windrowed
489
0.98
1.00
0.40
0.28
0.88
1.00
0.94
0.99
6
Soybeans-no till
968
0.64
0.61
0.14
0.16
0.34
0.48
0.60
0.42
7
Soybeans-min till
2468
0.48
0.71
0.07
0.44
0.59
0.60
0.43
0.68
8
Soybeans-clean till
614
0.63
0.51
0.33
0.14
0.48
0.35
0.62
0.41
9
Woods
1294
0.70
0.90
0.43
0.23
0.72
0.88
0.65
0.89
10
Bldg-Grass-Tree-Drives
380
0.67
0.28
0.14
0.06
0.77
0.28
0.79
0.27
Average Acc. and Average Rel.
0.67
0.66
0.20
0.21
0.59
0.61
0.63
0.62
Overall Acc.
0.83
0.62
0.80
0.80
Kappa coefficient
0.58
0.09
0.51
0.51
T
able
4. T
he
R
esults
of
C
lassification
A
ccuracy
O
btained
by
the
SVM C
lassifier
, 32 T
raining
S
amples
,
and
S
even
F
eatures
for
the
I
ndian
D
ataset
class
2DLDA
LDA
NWFE
GDA
No. of classes
Name of class
# samples Acc.
Rel.
Acc.
Rel.
Acc.
Rel.
Acc.
Rel.
1
Corn-no till
1434
0.80
0.59
0.38
0.47
0.68
0.54
0.66
0.38
2
Corn-min till
834
0.74
0.46
0.53
0.29
0.68
0.45
0.65
0.27
3
Grass/pasture
497
0.93
0.72
0.85
0.36
0.73
0.62
0.81
0.57
4
Grass/trees
747
0.84
0.85
0.76
0.78
0.84
0.76
0.79
0.87
5
Hay-windrowed
489
0.96
0.99
0.92
1.00
0.98
1.00
0.92
1.00
6
Soybeans-no till
968
0.57
0.64
0.39
0.34
0.54
0.49
0.47
0.43
7
Soybeans-min till
2468
0.46
0.81
0.30
0.61
0.40
0.74
0.09
0.65
8
Soybeans-clean till
614
0.72
0.60
0.57
0.38
0.46
0.39
0.27
0.52
9
Woods
1294
0.87
0.92
0.77
0.95
0.76
0.85
0.61
0.82
10
Bldg-Grass-Tree-Drives
380
0.48
0.49
0.62
0.56
0.55
0.43
0.46
0.26
Average Acc. and Average Rel.
0.74
0.71
0.61
0.58
0.66
0.63
0.57
0.58
Overall Acc.
0.86
0.78
0.82
0.76
Kappa coefficient
0.65
0.47
0.57
0.43
782
October 2015
PHOTOGRAMMETRIC ENGINEERING & REMOTE SENSING


