Weaker correlations are found between the
NIR
and
SWIR
,
followed by the
SWIR
and
SWIR
. Unlike the other crop types,
maize shows the highest correlations between
SWIR
and
SWIR
bands (1629 to 1730 nm). The highest correlation is at 1669
and 1699 nm (R
2
= 0.49). As with the single band plots, the
first (Plate 3) and second derivative transformed spectra
correlated over a much narrower range of bands than the
untransformed spectra. Correlations between biomass and
first derivative transformed spectra are comparable to the
untransformed spectra correlations, while second derivative
transformed spectra correlations (not shown) are lower. Table
2 shows the top ten ranked two-band predictors using first
derivative transformed spectra from the calibration subset. As
with the untransformed data, rice shows high correlations,
but over a much narrower range of wavelengths compared
to cotton and alfalfa. The highest correlations for rice occur
between the visible green and red-edge and
NIR
around 1225
nm. The highest correlations for alfalfa and cotton occur
between the visible blue and red-edge/
NIR
bands. Correlations
between the red-edge and
NIR
are not as high for cotton as
for alfalfa, nor are the correlations between visible and
SWIR
bands. Maize, again, did not have any ratios with R
2
>0.5. The
highest correlations are in the
NIR
.
Multiple Band-HVIs (Sequential Search Method)
Multiple band-
HVI
s
that correlated strongly with biomass for
each crop type and explained the most unique variance, while
meeting the sample size criterion are shown in Table 3. The
HNB
s are combined additively using the
FA
method. The table
shows the wavelength centroids used in the
FA
model for each
crop and transformation used (untransformed, first derivative,
and second derivative). No one transformation consistently
shows the highest correlations with biomass across crop type,
however, the second derivative transformation is the best for
two of the crops (rice and alfalfa). For rice, the best predictors
are in the visible and
NIR
. In the case of the untransformed
data, the 973 nm and 2052 nm
HNB
s for the untransformed
and 1
st
derivative transformed spectra would have explained
an additional 2 percent of biomass variance, but were not
included, because the sample size was too small or the pre-
dictor was not significant, respectively. For cotton, the best
predictors are found across the spectrum, the most significant
in the visible and red-edge. In the case of the untransformed
and first derivative transformed data, the addition of wave-
length centroids would have met the ΔR
2
criteria, but risked
over-fitting. For maize, the best predictors are found primarily
in the
NIR
, with the exception of the second derivative trans-
formed data, which included an important
SWIR
band (2042
nm). Additional bands could have been added that account
for significant unexplained variance by the second derivative
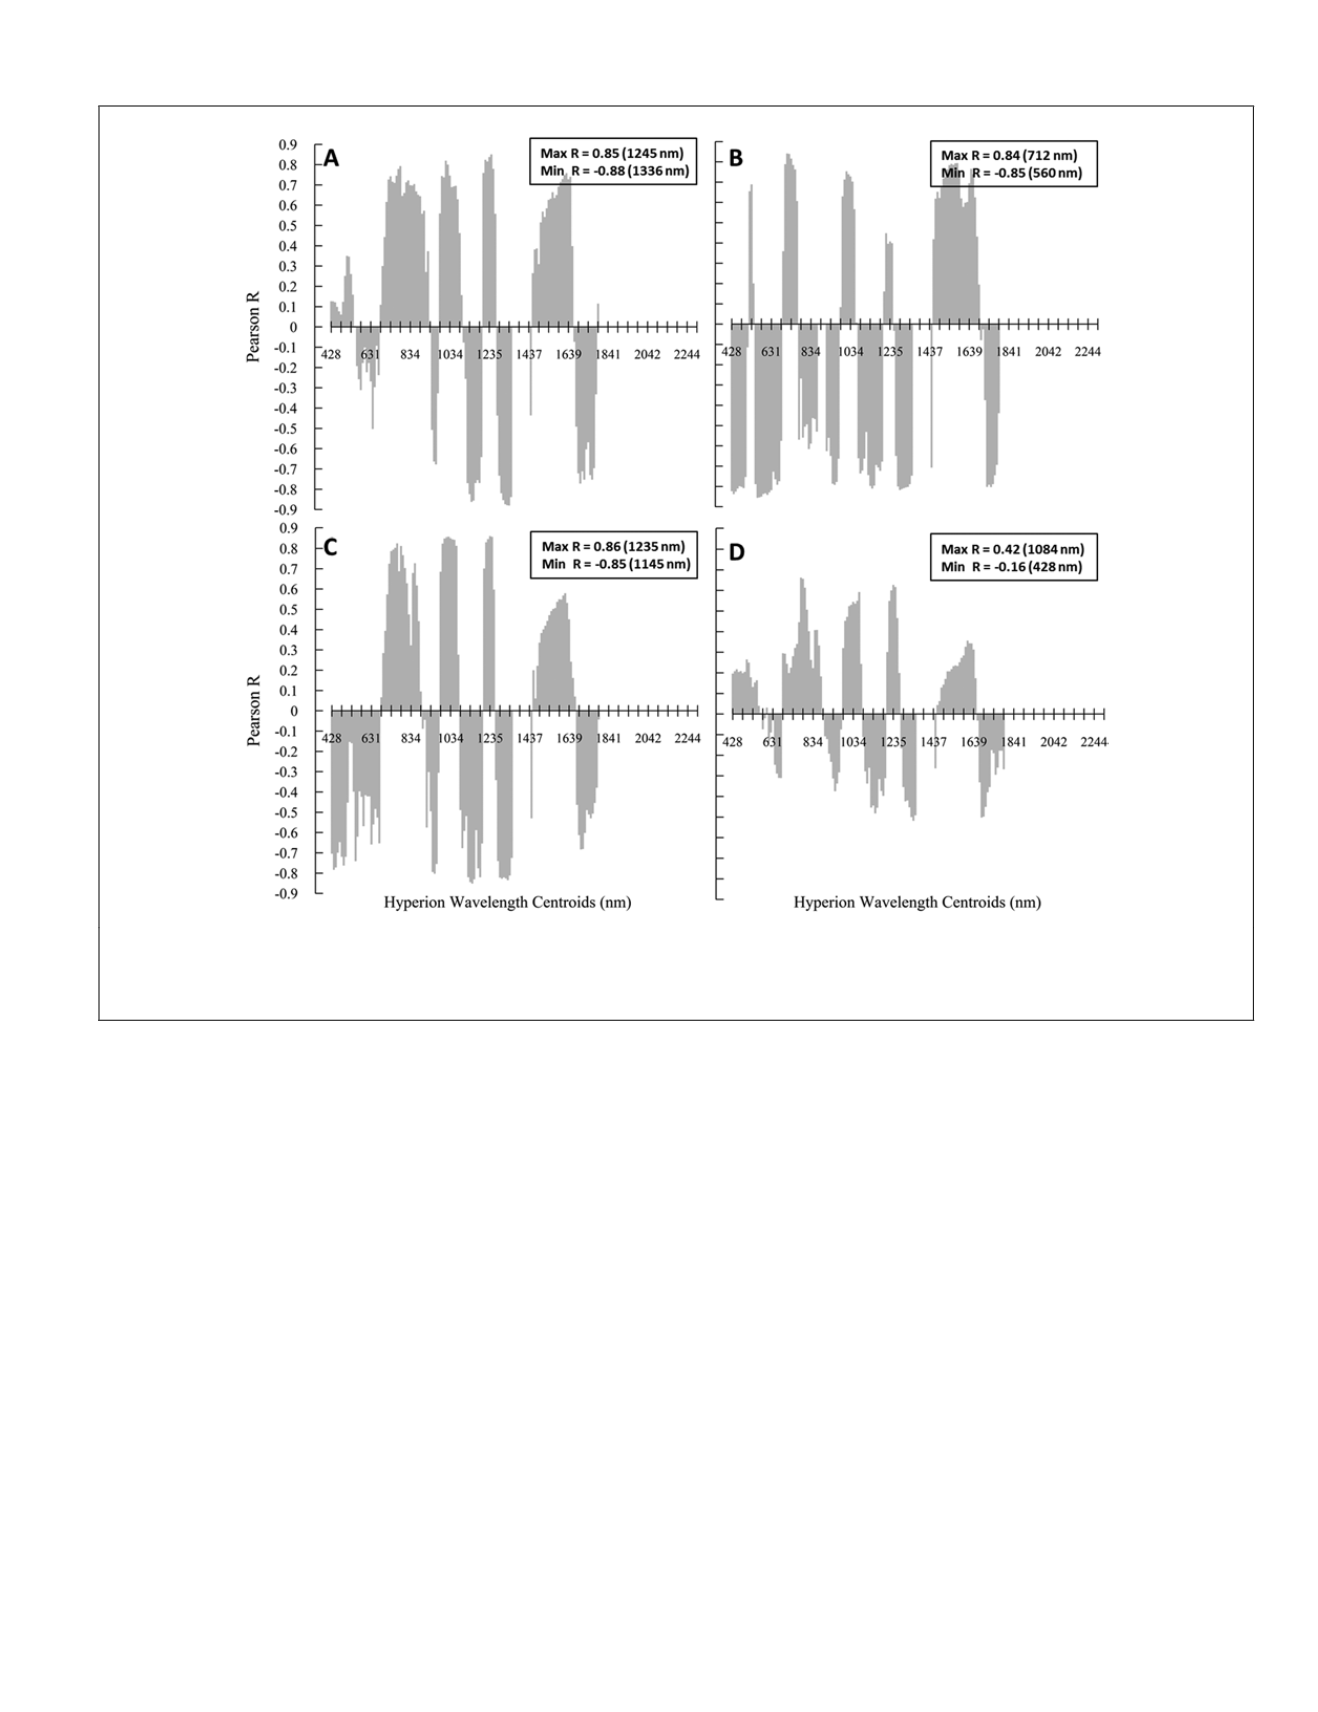
Figure 3. Pearson correlation coefficients (R) between 186 first derivative transformed and discrete (10 nm) channel reflectance and
crop biomass for (A) rice, (B) alfalfa, (C) cotton, and (D) maize. Ten of the bands at the end of the
swir
2 have been removed, because
of irregularities between the samples.
PHOTOGRAMMETRIC ENGINEERING & REMOTE SENSING
August 2014
763


