transformed data, but is restricted by the sample size.
Multiple Band-HVIs (Principal Component Regression)
Like
FA
,
PCA
is performed on a subset of samples containing
consistent missing
HNB
s. This yielded the same sample subset
as with
FA
. Principal Components Analysis requires that the
number of predictors is less than the number of samples, so
for each crop, predictors with Pearson correlations less than a
given threshold are omitted from the
PCA
to meet this criteri-
on. For rice, alfalfa, cotton, and maize, these thresholds are
|0.768|, |0.658|, |0.561|, and |0.117|, respectively. The
data is also rotated to aid in interpretation of the component
loadings. The rotated loadings, which describe the relative
contribution of each
HNB
to total component variance, yield
correlations with biomass similar to the unrotated scores.
The orthogonally rotated loadings for each
HNB
greater than
|0.7| are shown in Table 4. Since the data in Table 4 is
rotated orthogonally, the first two components of each crop
type explain nearly half of the total variance. Components
not shown in Table 4, are either significant in the final
PCR
model, but explained a small proportion of biomass variabil-
ity, or are insignificant at the 99.9 percent confidence band.
The first component for rice explains 50 percent of the total
variance, while the second component explains just less than
50 percent of the total variance. The first component con-
sists of wavelengths exclusively in the
NIR
(753 to 1276 nm).
Loadings that explain 50 percent or more of the total factor
variance (weight >|0.7|) are from 773 to 794 nm on the first
component and from 943 to 1276 nm on the second compo-
nent. The first component of alfalfa explains 54 percent of
the total variance, while the second component explains 44
percent of the total variance. The first component shows high
loadings in the visible/red-edge (428 to 702 nm) and the
SWIR
(1477 to 1548 nm), while the second component shows high
loadings in the
NIR
(743 to 1074 nm). The first component of
cotton explains 49 percent of the total variance, while the
second component of cotton explains 48 percent of the total
variance. The first component has the highest loadings in the
NIR
(743 to 1134 nm), while the second component has the
highest loadings in the visible/red-edge (428 to 702 nm) and
the
SWIR
(1447 to 2012 nm). For maize, the first component
explains 70.5 percent of the total variance, while the second
component explains 22.0 percent of the variance. The first
component loads high in the
NIR
(722 to 1346 nm), while the
second component loads high in the
SWIR
(2002 to 2295 nm).
The first two components are selected for rice, alfalfa, and
cotton, while the first three components are selected for maize
to compute scores, which are used to develop
PCR
models.
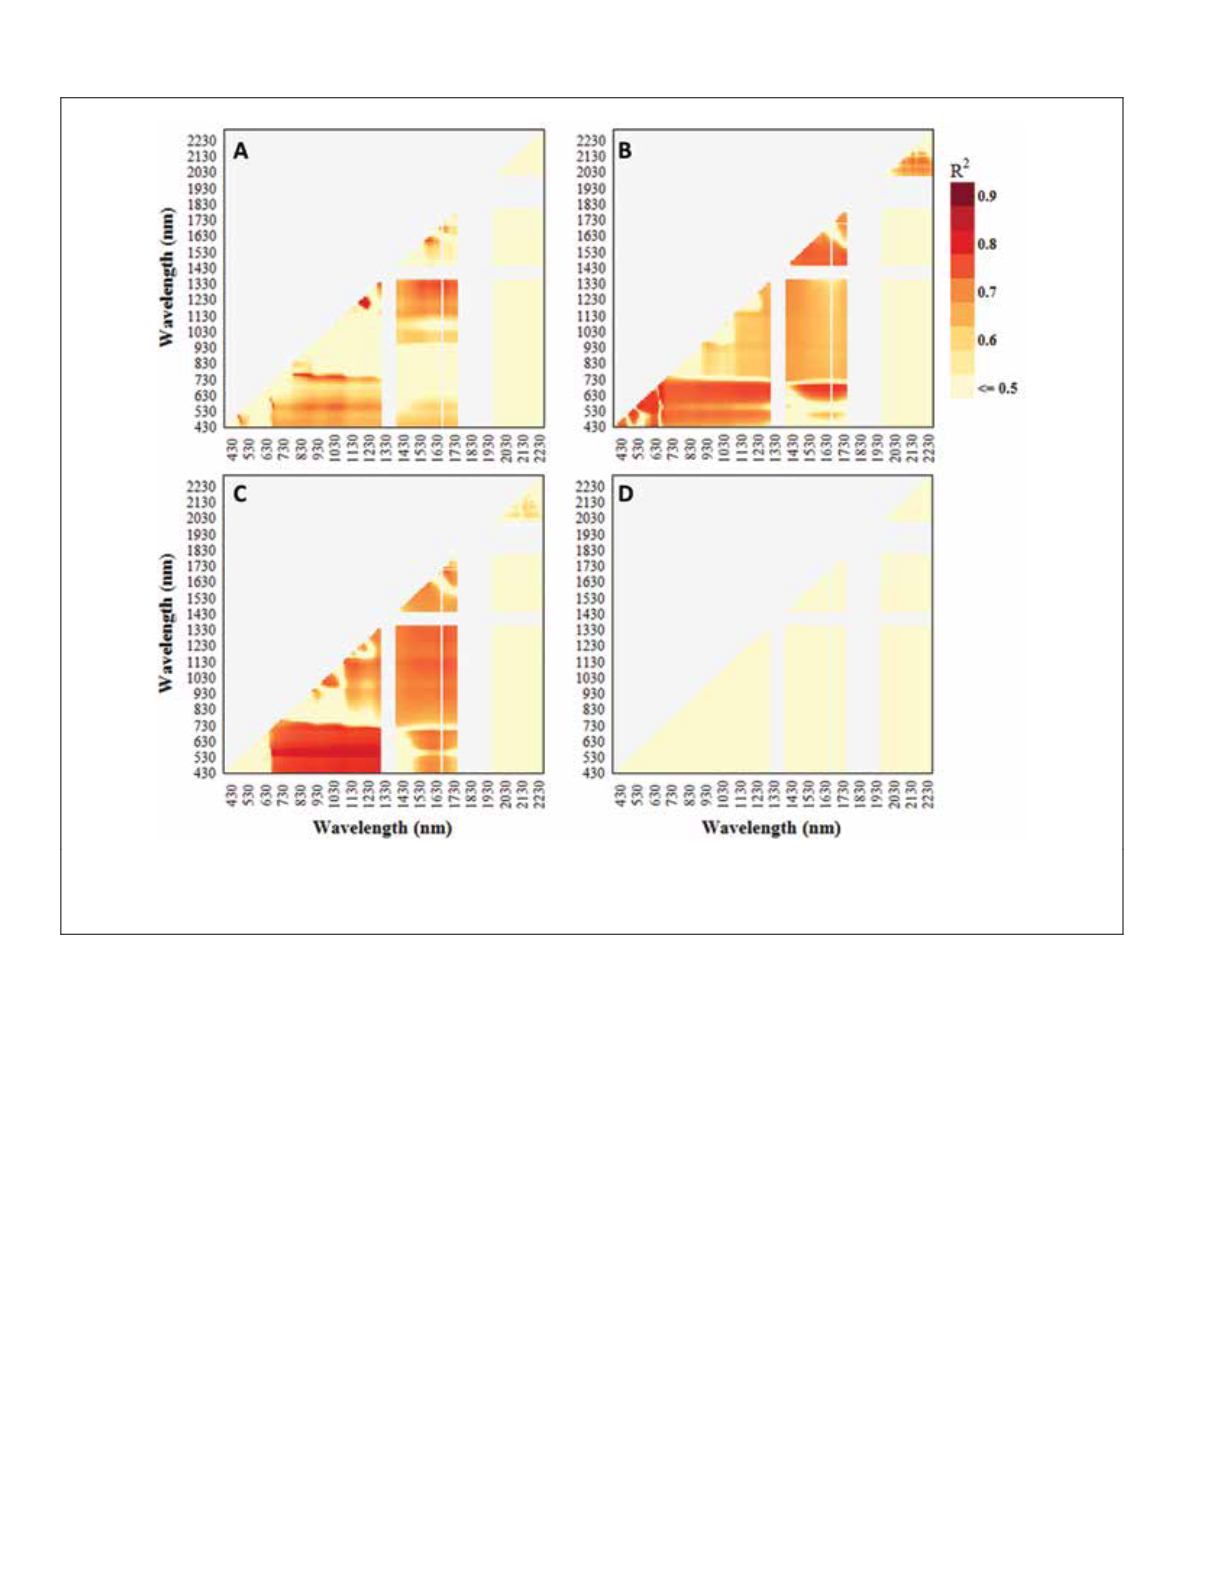
Plate 2. Lambda-lambda (R
2
) contour plots, based on 186 untransformed and discrete (10 nm) bands and crop biomass for (A) rice,
(B) alfalfa, (C) cotton, and (D) maize (d). Dark red regions highlight potential two-band
hvi
s
. Ten of the bands at the end of the
swir
2
have been removed, because of irregularities between the samples.
764
August 2014
PHOTOGRAMMETRIC ENGINEERING & REMOTE SENSING


