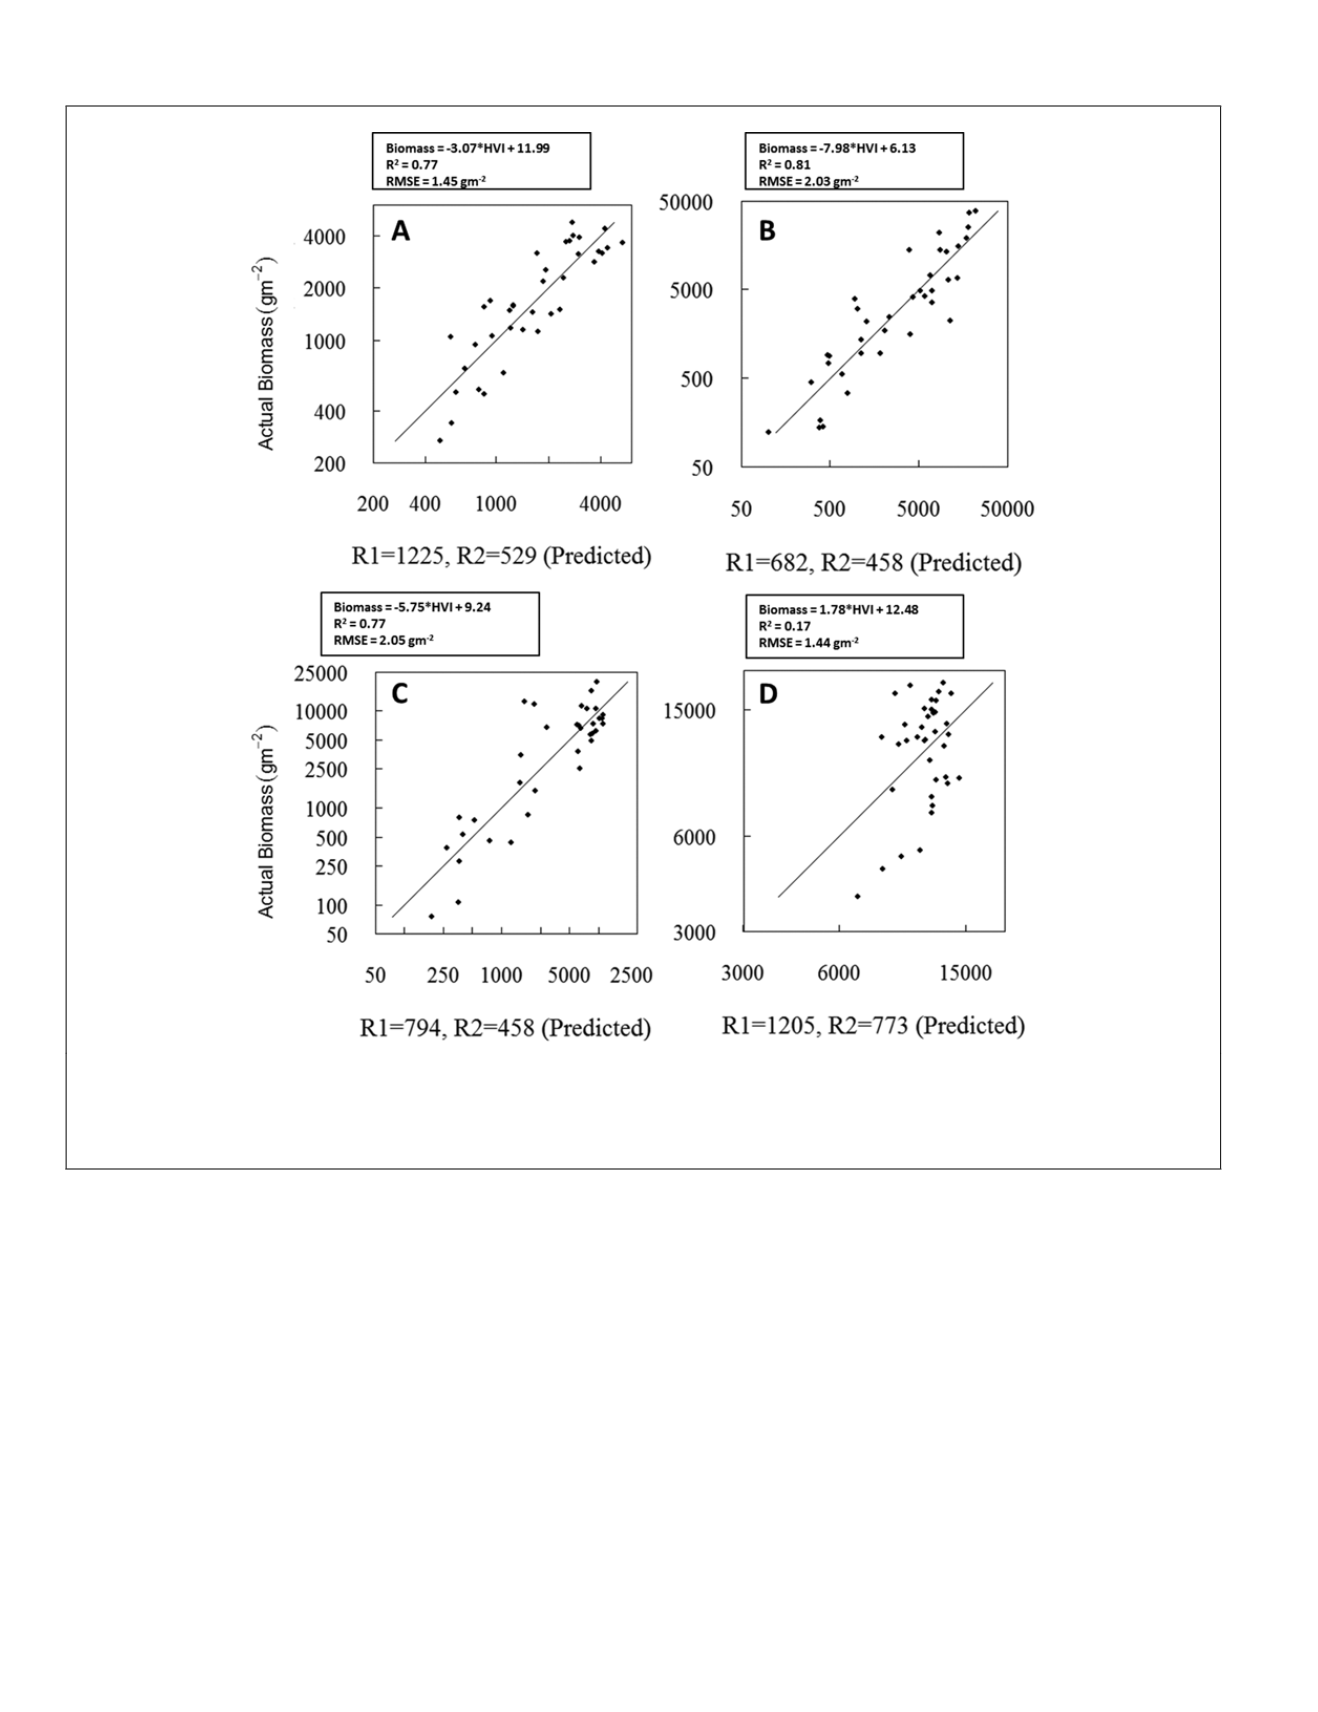
Figure 4. Scatterplots of observed biomass versus predicted biomass for the highest ranked first derivative transformed two-band
hvi
on the calibration dataset subset for (A) rice (N=37), (B) alfalfa (N=37), (C) cotton (N=35), and (D) maize (N=37). The diagonal line
represents a 1:1 relationship. The band centroids used to derive the HBVIs are shown on the x-axes. Also shown is the prediction
formula, explained variance, and root mean squared error (
rmse
).
in later growth stages. With a larger sample size in the future, the analysis should be performed again for each crop at each major
phenological phase to resolve this issue.
It is difficult to select one statistical method over another, but we can say that the two-band
HVI
and
MB-HVI
using
SSM
ap-
proaches yield significantly higher R
2
and lower
RMSE
than the
PCR
approach. Rice and alfalfa show lower
RMSE
and modestly
higher R
2
using the two-band
HVI
approach, while cotton and maize perform better using
FA
. All three methods under-predicted
biomass during the sprouting phase and this could be due to the low (high) absorption and reflectance of incoming radiation by
the canopy (soil) (Huete, 1988).
The major advantage of
FA
and additive models in general are that errors are smaller than two-band
HVI
models due to the
way in which variables are combined and the model-building process is simpler to implement and evaluate. The major disad-
vantage of this approach, as is the case with cotton, is that they typically include more
HNB
s, which can induce another type
of error. With a larger sample size, the number of predictor variables could be increased and/or a stepwise regression could be
performed to reduce the probability of eliminating collinear, but highly significant
HNB
s.
The major advantage and disadvantage of the two-band
HVI
approach is its flexibility. Many of the two-band
HVI
s that ranked
high in the calibration dataset with a R
2
≤
0.02 from the top ranked
HVI
, often performed better on the validation subset. The
two-band
HVI
for rice at 1225 and 539 nm, for alfalfa at 1205 and 438 nm, for cotton at 1023 and 428 nm, and for maize at 1205
and 794 nm, ranked high on the calibration subset and explained 78, 86, 84, and 22 percent of the variability in the validation
subset, respectively. Other high correlations are seen at 1205 and 438 nm, as well as at 1629 nm across the visible for alfalfa, while
combinations at 428 nm around 763 nm are also strong for cotton. It is recommended when using the two-band
HVI
approach that
a cross-validation is performed for all two-band
HVI
combinations to minimize errors without the need for a calibration and vali-
768
August 2014
PHOTOGRAMMETRIC ENGINEERING & REMOTE SENSING


