396
May 2014
PHOTOGRAMMETRIC ENGINEERING & REMOTE SENSING
Figure 1 represents the scores of four target shooters. The
extreme left score shows the shooter managed to cluster all
of his shots nears the bull’s eye. However the shooter failed
to have them tightly cluster as they were distant from each
other. In such case, we say the shooter is accurate, as he/she
managed to get all the shots within the bull’s eye circles, but
not precise as the shots were scattered around. The results
from the the second shooter shows exactly the opposite
situation where the shots were very close to each other
(precise) but they are far from the bull’s eye (not accurate). In
this case we say the shooter is precise but not accurate. The
shooter in this case is most likely using a badly calibrated
riflescope. Once, the riflescope is calibrated correctly, all
shots are expected to move around and close to the pull’s eye.
Using the same analogy, we describe the third shooter to be
precise and accurate while the fourth one is neither precise
nor accurate.
Precision errors sometimes are called “random errors” or
accidental errors which are usually assessed by applying
statistical concepts. Accuracy errors are sometimes called
“systematic errors” and can be reduced through calibration.
The Mean
: The arithmetic mean or average is a value such
that the sum of deviations of observations from it is zero. In
other words, it is the sum of the observations divided by the
number of observations, or
1
Where
x
i
is an observation or measurement,
n
, is the total
number of observations, and
x
_
is the mean.
The Standard Deviation
: The standard deviation,
s
,
is a term used to express the precision of a group of
measurements. It is measured by the root-mean-squares
(RMS) of the deviations of the measurements from the Mean.
The deviation is the difference between the observation value
and the mean of the sample or
x
i
–
x
_
.
Therefore, the standard deviation,
s
, for the sample can be
represented by the following formula:
1
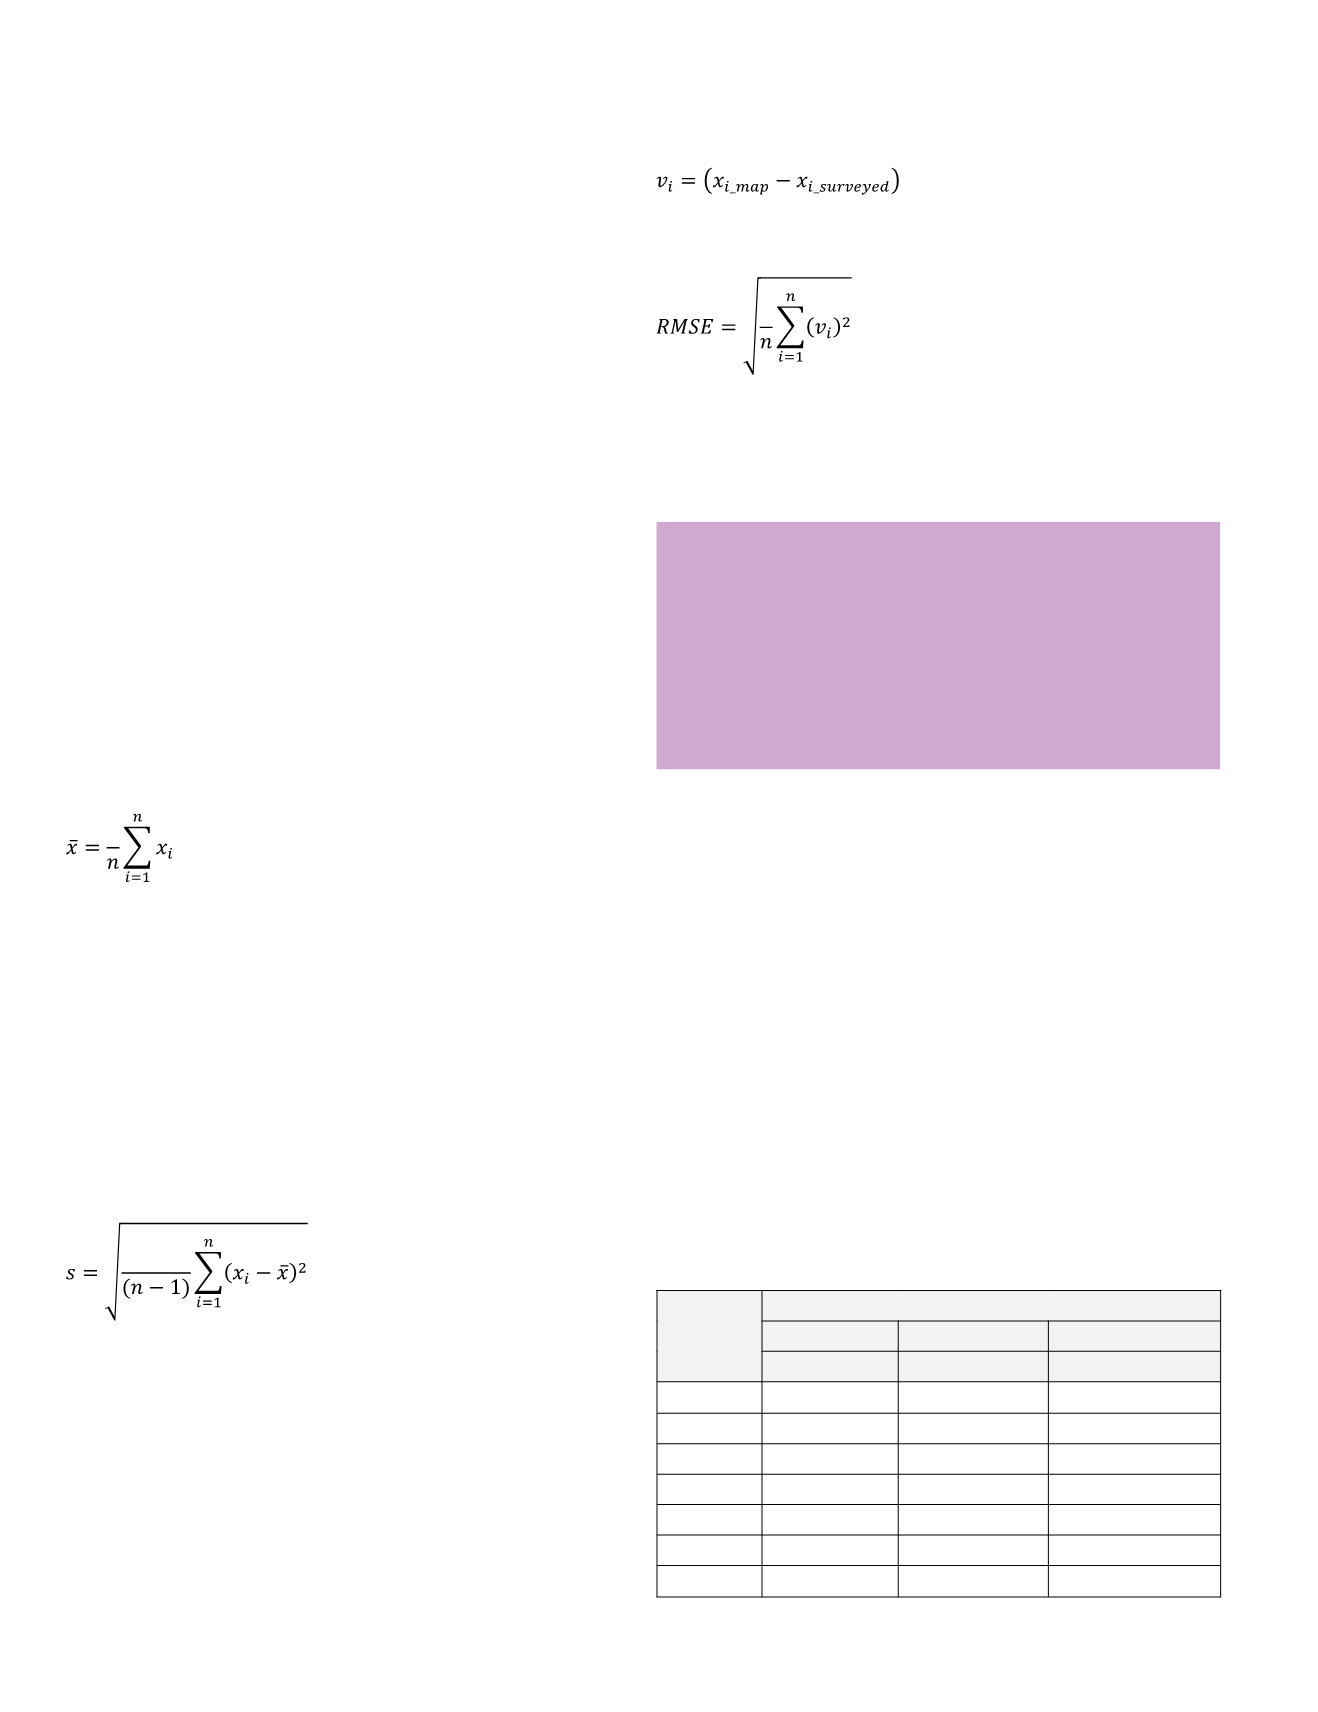
Root Mean Squares Error (RMSE):
The term RMSE is
similar to the Standard Deviation but instead of representing
the root-mean-squares (RMS) of the deviations of the
measurements from the Mean, it represents the root-mean-
squares (RMS) of the residuals or errors. Residual is the
difference between any measured quantity and the most
probable value for that quantity. In a simpler expression that
is more suitable for our mapping practices, it is the difference
between the map-measured value of a ground control or check
point coordinates and its corresponding field surveyed value.
It can be represented by the following formula:
Therefore, the RMSE can be represented by the following
formula:
1
To practically illustrate how each of the above statistical
terms are obtained, I will provide a numerical example
on accuracy determination and verification process for a
mapping project.
Example:
For the accuracy verification of a 7.5 cm ortho photo and one-
foot contour Lidar data delivery, the vendor surveyed 7 check
points well distributed through the project. The number of
seven points is selected only to simplify the computations,
otherwise a minimum of 20 points is recommended in order to
obtain a statistically valid sample for the accuracy verification.
An operator then visited all the seven locations of the check
points on the orthos and Lidar data and recorded the measured
coordinates. Tables 1 and 2 contain the surveyed and measured
values for the seven check points, respectively. Here we always
assume that the Easting and Northing measurements were
obtained from the ortho photo while the elevation is measured
on the lidar data. How would you evaluate the accuracy of such
data given that the data should meet class I accuracy according
to the ASPRS map accuracy standard of 1990?
Table 1 Ground Surveyed Coordinates of Check Points
Point ID
Surveyed Values
Easting (E)
Northing (N)
Elevation (H)
meter
meter
meter
CHK1
435497.833 5180054.928
345.664
CHK2
435725.556 5165270.361
468.892
CHK3
435979.496 5175221.310
443.026
CHK4
439669.621 5188155.808
190.813
CHK5
448111.664 5184557.992
190.458
CHK6
450709.372 5164362.835
433.851
CHK7
452302.531 5175489.942
226.230
“Without understanding these
(statistical) basic and simple terms,
individual who are involved in maps
accuracy analysis will remain confused
and sometime helpless”


