PHOTOGRAMMETRIC ENGINEERING & REMOTE SENSING
May 2014
397
Table 2 Map-measured Coordinates of Check Points
Point ID
Measured Values
Easting (E)
Northing (N)
Elevation (H)
meter
meter
meter
CHK1
435497.773
5180055.008
345.719
CHK2
435725.656
5165270.316
468.886
CHK3
435979.436
5175221.390
443.009
CHK4
439669.309
5188155.815
190.855
CHK5
448111.544
5184558.142
190.447
CHK6
450709.272
5164362.790
433.864
CHK7
452302.471
5175490.022
226.278
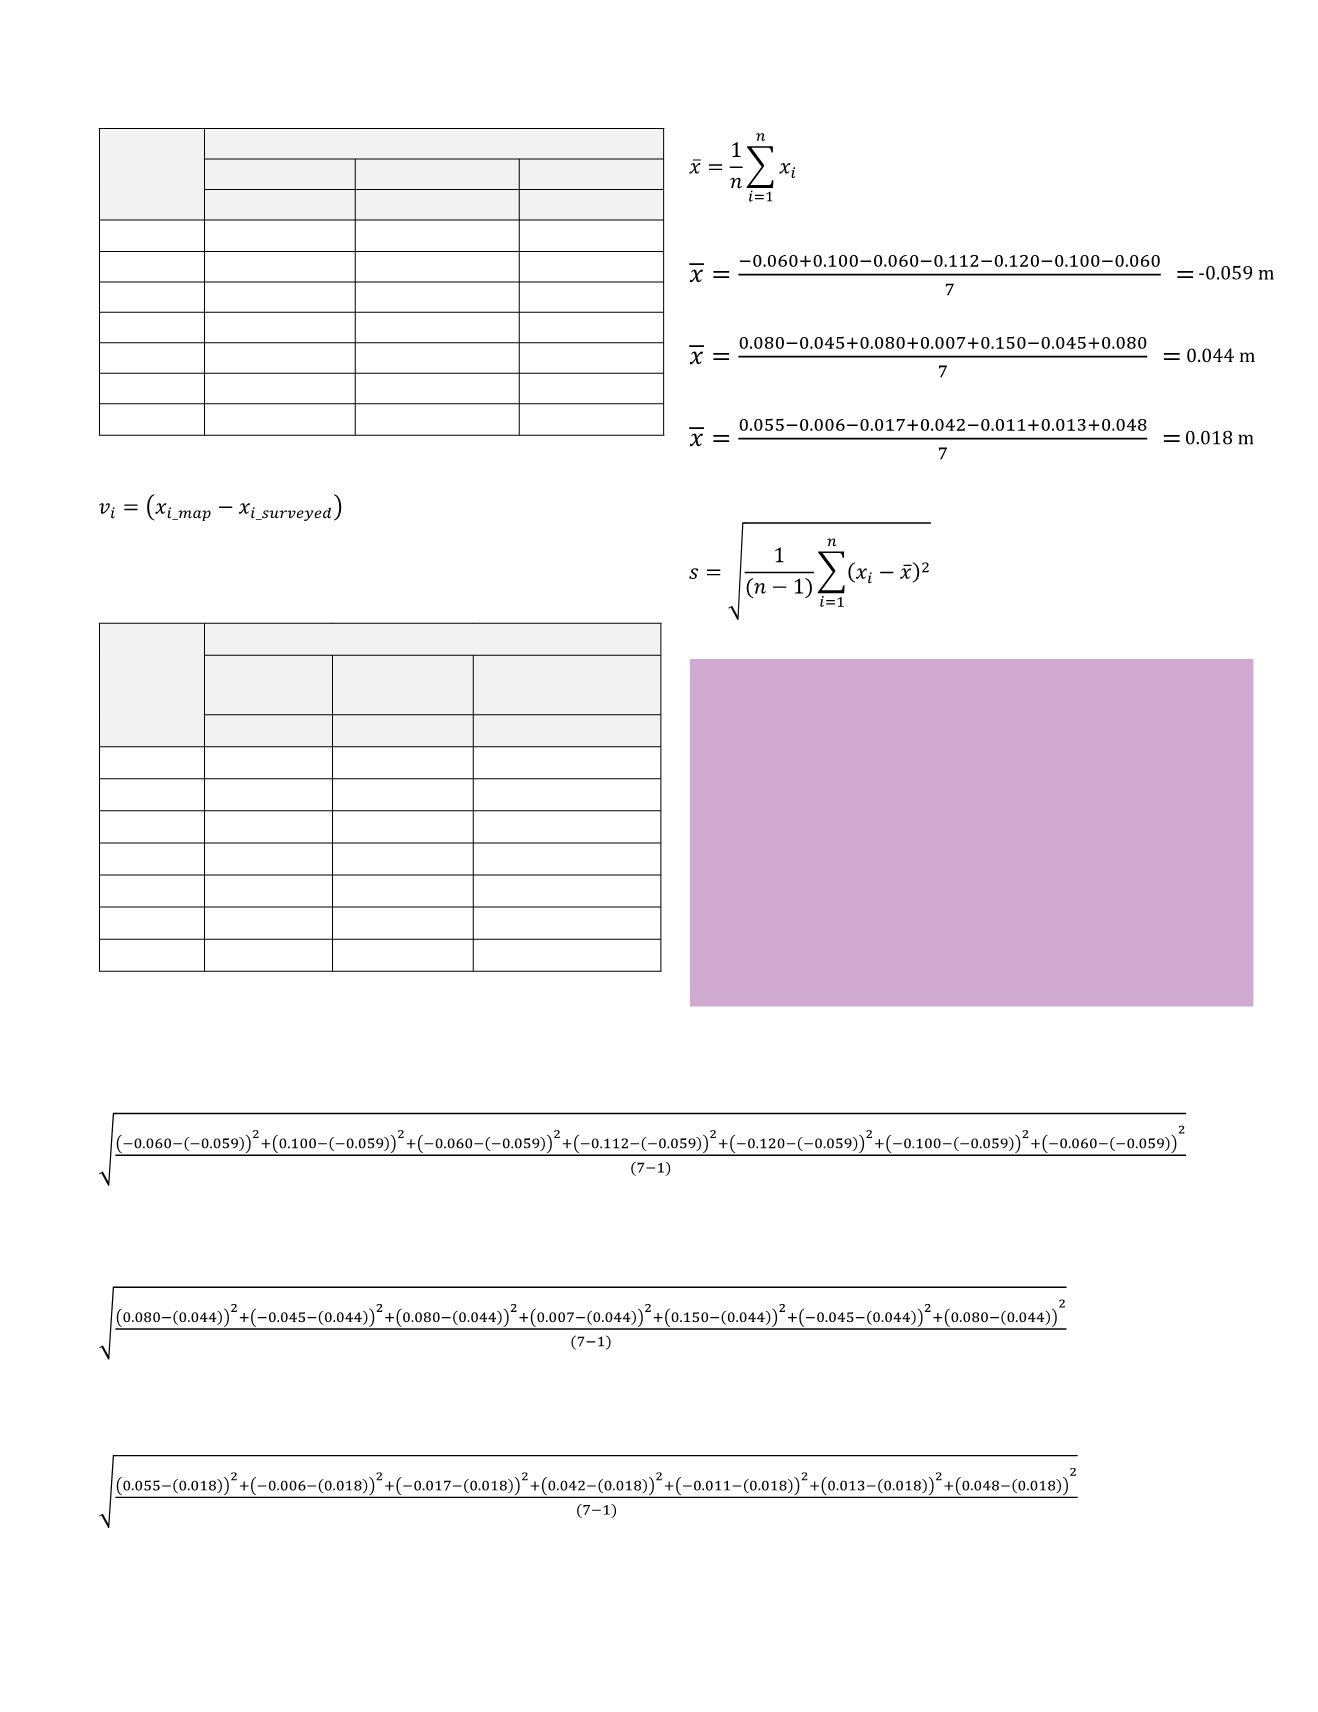
Step1:
Compute the residual for each check point
Table 3 contains the computed residuals for the check points.
Table 3 Residuals computations
Point ID
Residuals
ΔE
(Easting)
ΔN
(Northing) ΔH (Elevation)
meter
meter
meter
CHK1
-0.060
0.080
0.055
CHK2
0.100
-0.045
-0.006
CHK3
-0.060
0.080
-0.017
CHK4
-0.112
0.007
0.042
CHK5
-0.120
0.150
-0.011
CHK6
-0.100
-0.045
0.013
CHK7
-0.060
0.080
0.048
STEP 2:
Compute the Mean
Mean error in Easting:
Mean error in Northing:
Mean error in Elevation:
STEP 2:
Compute Standard Deviation
Standard Deviation in Easting:
s
x
=
= 0.075 m
Sample Standard Deviation in Northing
s
y
=
= 0.073 m
Standard Deviation in Elevation
s
z
=
= 0.030 m
“The best way to evaluate biases is
to examine the Mean values. Mean
value that exceed 25% to 50% of the
RMSE value may indicate the presence
of a bias in the measurements on
condition that the standard deviation
(the fluctuation in the measurements) is
low.”


