is assumed to be maximum (= 1) as by definition reference
objects are assumed to be perfectly accurate. In summary:
J
X
= G TSI
X X
with X
∈
[R,F]
(4)
Then the
KS
goodness-of-fit test is applied as in the original
method of Möller
et al.
(2013) but now using the cumulative
distribution functions of J
R
and J
F
. Therefore, D
+
= max
+
|f(J
F
)-
f(J
R
)| and D
–
= max
–
|f(J
F
)-f(J
R
)|. The resulting global metric M
j
for the whole segmentation results from the difference between
D
–
and D
+
. Like the geometric-only global metric M
g
, also M
j
~
0 is considered indicative of optimal segmentation quality.
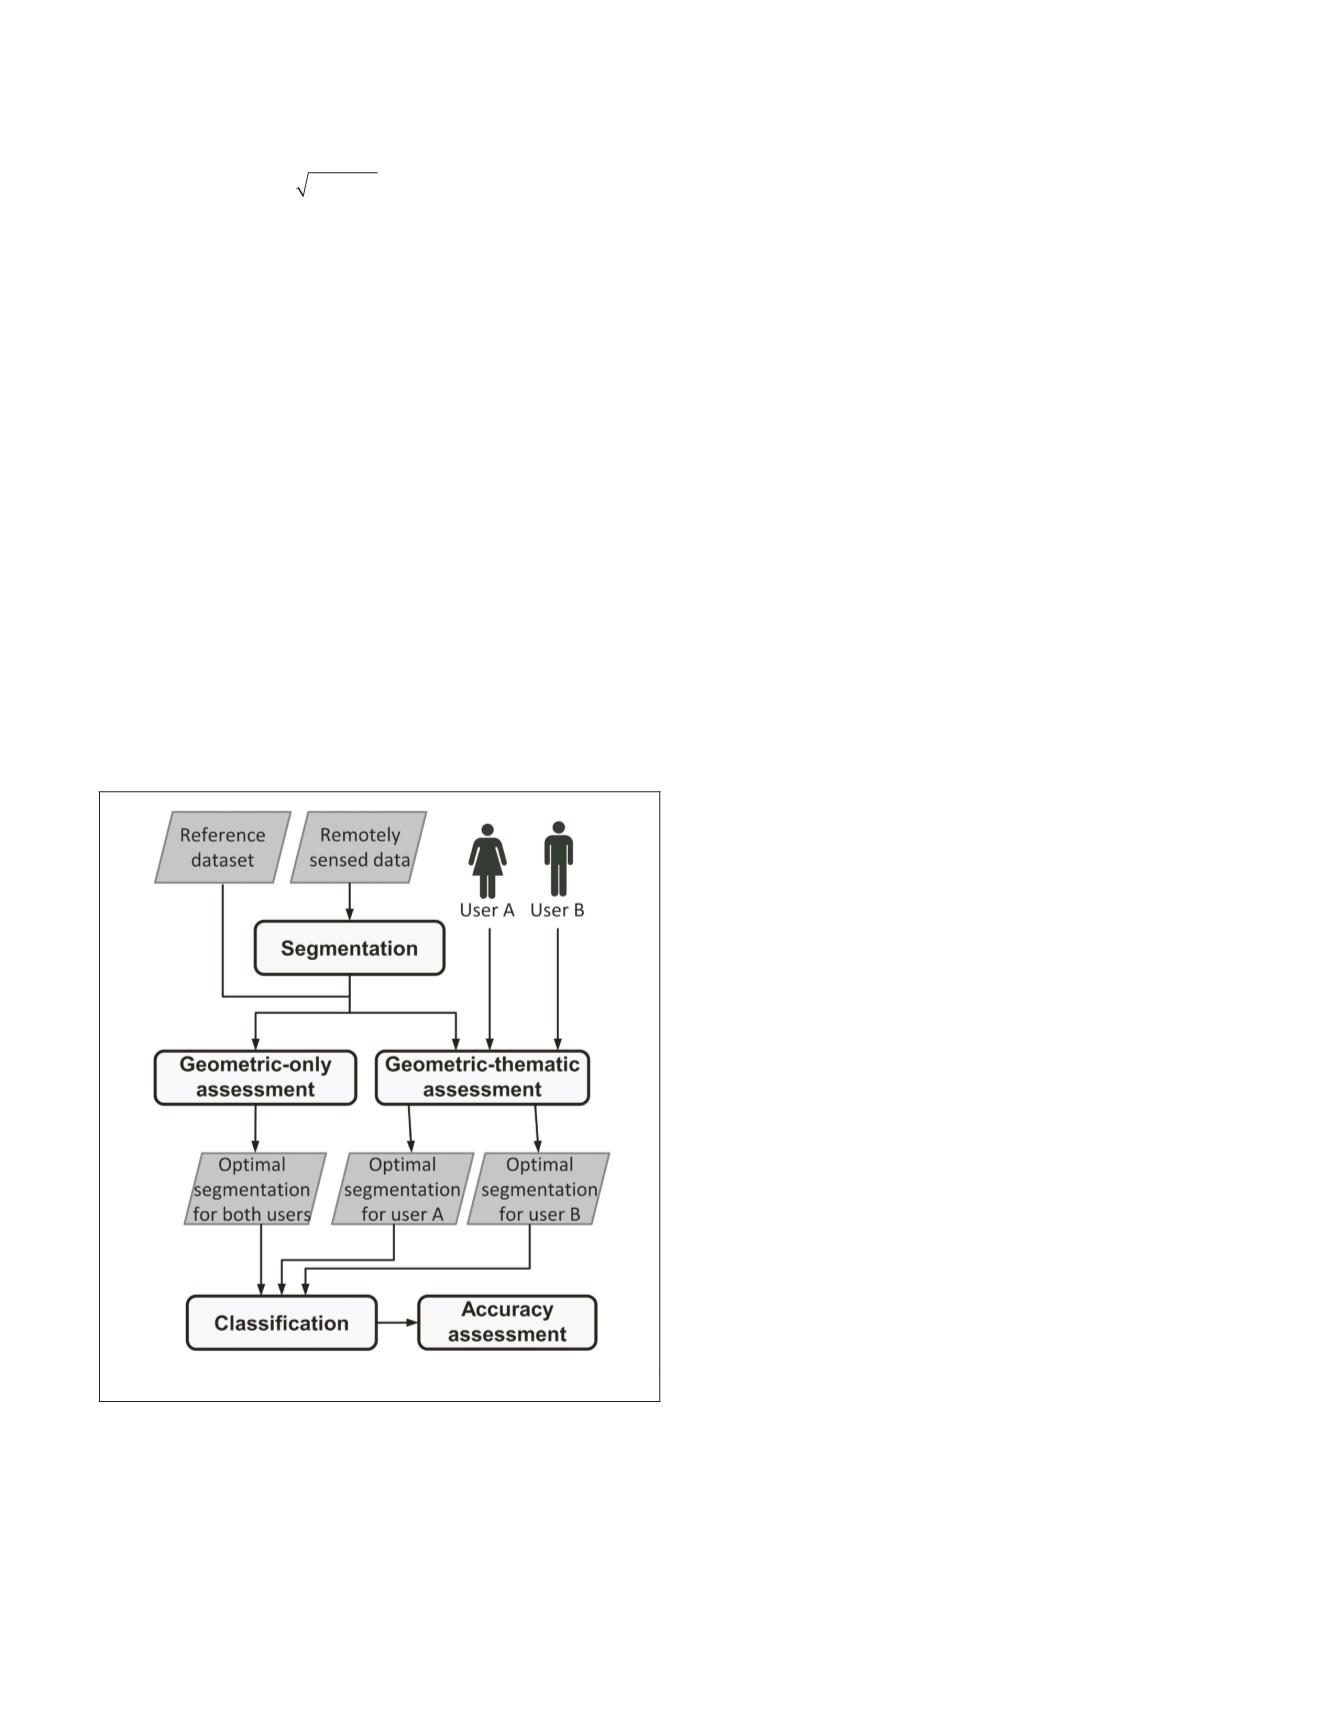
Case Study
Using a region in northern Portugal as the study area, re-
motely-sensed data were submitted to segmentation analysis.
A series of segmentations was produced and all segmenta-
tions were assessed with the geometric-thematic method for
two different users. In addition, the geometric-only method
of Möller
et al.
(2013) was used for comparative purposes
to indicate the potential enhancement that arises from the
incorporation of user specific information on thematic mis-
classification severity indicated by the
TSI
. Then, the results
indicated as optimal by each method were used to derive land
cover classifications. It is hypothesized that the segmentations
indicated as optimal by the geometric-thematic method result
in higher classification accuracy as compared to the result
selected by the geometric-only method. Figure 6 summarizes
the methodological workflow of the case study.
Figure 6. Study case workflow.
Study Area and Datasets
The analyses focused on a 44,820 ha test site in northern Por-
tugal (Plate 1). This area corresponds to the downstream part
of the Minho River and includes a diverse range of land cover
types, such as forest, agriculture, bare soil, and settlements,
and rather patchily distributed in a heterogeneous landscape.
Images acquired by the
LISS-III
sensor onboard
IRS-P6
were
used. Specifically, two images acquired in spring (26 May)
and summer (06 August) of 2006; both are included in the
IMAGE2006
(European Coverage) product. Each image is com-
posed by four spectral bands (green, red, near infrared, and
short wave infrared), and was geometrically corrected at 25 m
spatial resolution (Müller
et al.,
2009).
The
CORINE
Land Cover map of 2006 (
CLC
2006) was used as
reference data. The
CLC
2006 is a vector cartographic product
produced through visual interpretation and manual clas-
sification of remotely sensed data (EEA, 2007). The area of
the
CLC
2006 that covers the study area was derived from the
two
LISS-III
images described above (Caetano
et al.
, 2009). The
level 2 of the
CORINE
nomenclature was used except for water
classes, which were considered as a single class as defined in
level 1 of the nomenclature. In total, 12 thematic classes were
found over the study area (Plate 1).
Similarly to, for example, Möller
et al
. (2007) and Whi-
teside
et al
. (2014), the study area was sampled to define
a reference dataset for image segmentation quality assess-
ment. The assessment results calculated for the sampled area
was assumed to be representative of the whole study area.
The sampled area consisted of ten randomly located square
patches each of 1,500 m × 1,500 m in size, and together repre-
sent ~5 percent of the study area (Plate 1). The
CLC
2006 over
the random sample was used for image segmentation quality
assessment. The rest of the study area was used for classifica-
tion accuracy assessment.
The ten randomly located square patches were also used
as the training areas for a set of supervised image classifica-
tions. However, as only a small number of polygons for some
land cover classes were contained within the patches in the
CLC
2006 map, another map was used in training the clas-
sifier: the “Carta de Ocupação do Solo” of 2007 (
COS2007
).
The
COS2007
is a land cover map produced by manual clas-
sification through visual interpretation of aerial imagery. Its
minimum mapping unit (
MMU
) is one ha, and land cover is
represented according to a nomenclature of five hierarchical
levels: the first three of them are the same as
CORINE
nomen-
clature. The level 2 and level 1 (for water classes) were used
as above. Therefore, the nomenclature of
COS2007
and
CLC
2006
data used are fully compatible.
Users
Two specific user perspectives on segmentation quality were
adopted: that of a wolf researcher and that of a general user of
land cover information. The former is a researcher studying the
reproductive behavior of wolves in terms of habitat selection for
den sites and rendezvous sites, for which land cover maps are
paramount, as they are a source of information on the location
and types of habitats. A thematic similarity matrix for a wolf
researcher (Table 1) was built based on expert knowledge pro-
vided by the biologist Helena Rio-Maior, who has been studying
the ecology and conservation of the Iberian wolf (
Canis lupus
signatus
) in northern Portugal (Rio-Maior
et al.
, 2012).
The second user considered was simulated to represent
a typical user of land cover information. Rather than using
arbitrary values, the thematic similarity weights of Table 2
were based on the priority table used in the production of
CORINE
land cover maps to guide the manual generalization
of polygons smaller than the
MMU
of 25 ha (EEA, 2007). This
priority table defines criteria on how small polygons are
merged to larger neighboring polygons according to the land
cover classes contained. Specifically, the table defines levels
of priority for merging between the 44 classes of the third
level of the
CORINE
nomenclature, thus expressing similarity
between then. This priority table was normalized in order to
all values range from 0 (minimum similarity) to 1 (maximum
similarity) and the classes were aggregated to the second level
of the
CORINE
nomenclature.
PHOTOGRAMMETRIC ENGINEERING & REMOTE SENSING
June 2015
455


