of the tree. Finally, the root node represents the whole image.
Each node records the labels of its parent node and children
nodes, building the hierarchical links between multi-scale
segments. Then, we can find all the corresponding leaf nodes
for each node in the segment tree. After combining the initial
segments represented by the corresponding leaf nodes of a
tree node, we can obtain the region indicated by the tree node.
When exporting a segmentation result at scale
S
k
, we cut the
segment tree at level
k
+ 1, which is to find all the leaves
corresponding to each node at the level. Once the segment tree
has been built, it is much more efficient to produce multi-scale
segmentations by cutting the tree at different levels than by
repeating the similar region growing procedure in many times.
Finally, if the target scale
k
is coarse enough and the
meaningful scales are included in the segment tree, then
users can select the proper scale(s) by cutting the tree for
specific applications. However, if the nodes at the coarsest
level, except for the root node, are still too fine to represent
certain objects, a larger scale parameter needs to be set to
produce coarser segments. In this case, region growing is not
performed based on the initial segmentation but on the graph
nodes related to the coarsest level of the segment tree, which
avoids repeating the same growing procedure from the initial
segmentation to the coarsest level.
Experiments
Data and Evaluation Methods
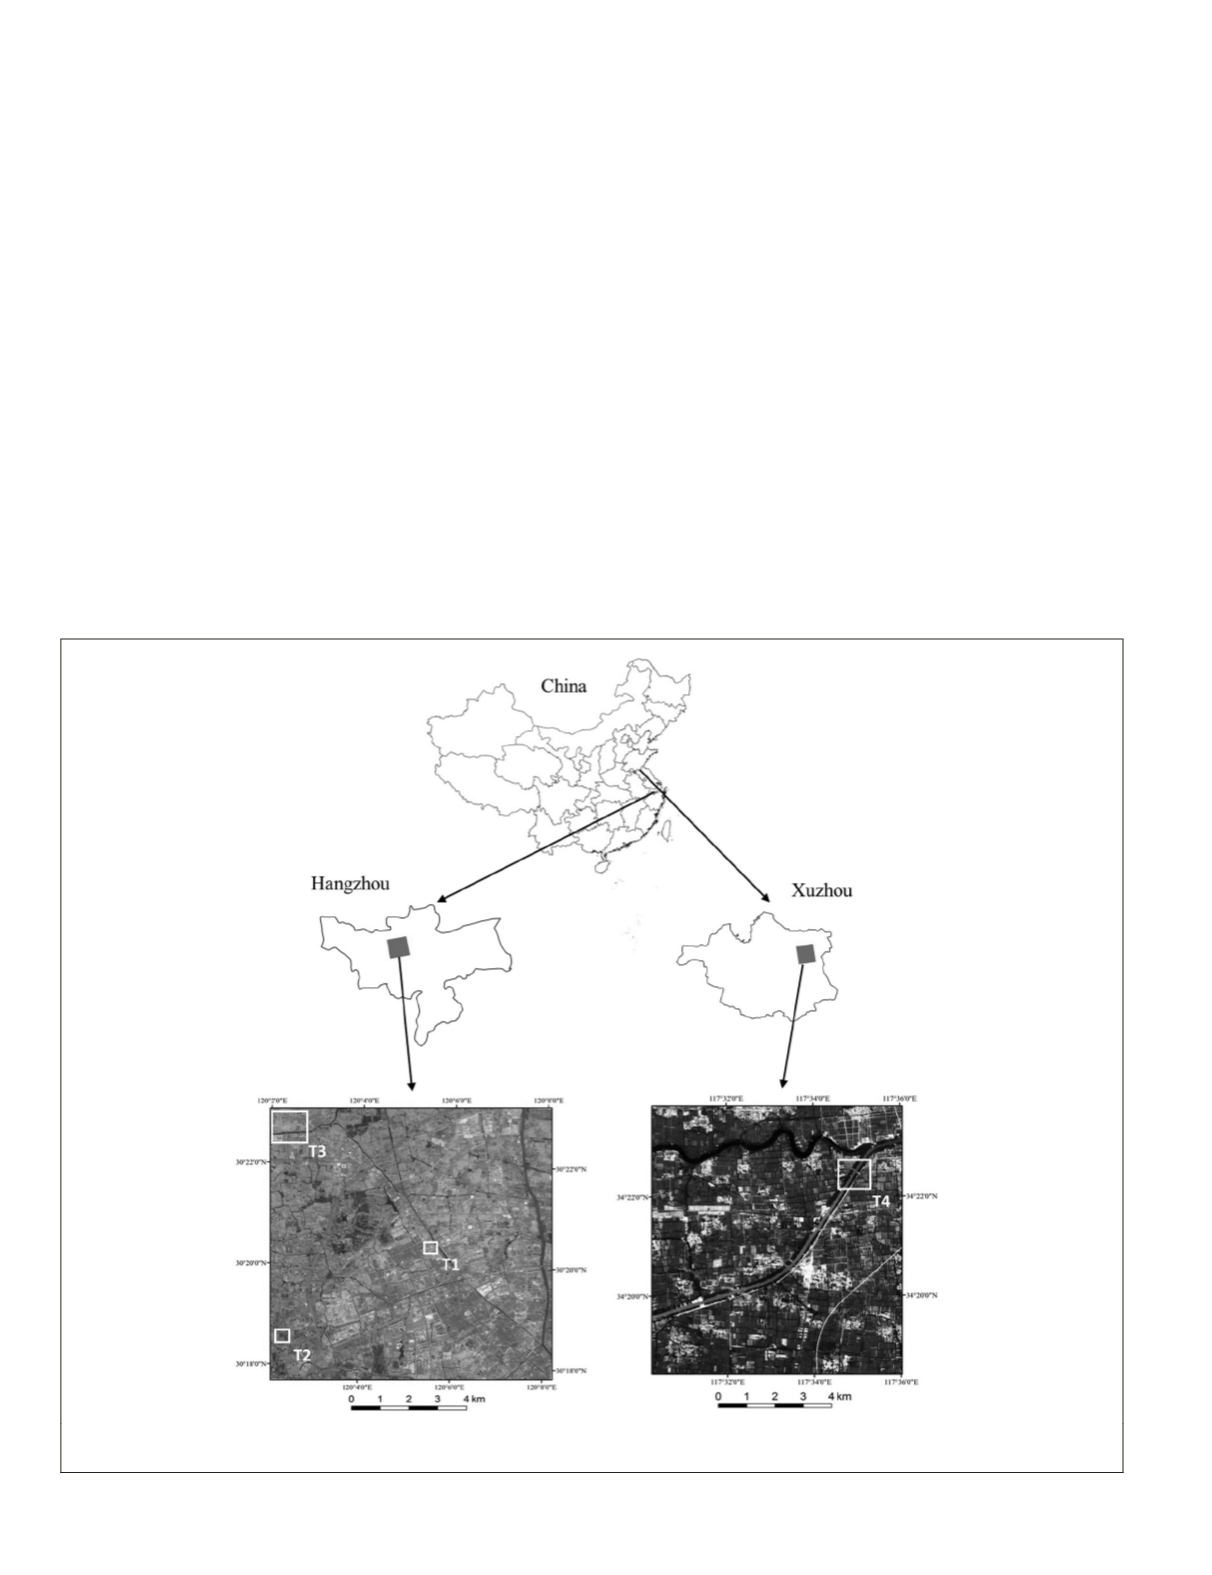
A QuickBird-2 scene acquired on 02 March 2008 in Hang-
zhou, China and a WorldView-2 scene acquired on 20 May
2010 in Xuzhou, China are used in the experiment, as shown
in Figure 3. Three subsets of the QuickBird scene and one
subset of the WorldView scene are selected as samples to
show the effectiveness of
AISP
. The test images are called as
T1 to T4, respectively.
The spatial resolution of T1 and T2 is sharpened to 0.6
m by the method proposed by Zhang (2002), as shown in
Figure 4. The test images T3 and T4 are shown in Figure 9.
The spatial resolution is 2.4 m and 2.0 m, respectively. The
sizes of T1 to T4 are 658× 504, 538 × 546, 512 × 512, 512 ×
512 pixels. The test images T1 and T3 represent an urban
landscape, and T2 and T4 indicate a rural landscape.
The supervised evaluation is performed on T1 and T2 to
show the segmentation accuracy. The references are produced
by manual delineation to separate different geographic
objects, as shown in Figure 4. There are 165 and 106 reference
objects for T1 and T2, respectively. The supervised evaluation
indicators include the bidirectional consistency indicator
(
BCE
) (Martin, 2003), symmetric partition distance (
D
sym
)
(Cardoso and Corte-Real, 2005), and adjusted Rand index
(
ARI
) (Hubert and Arabie, 1985).
Figure 3. Locations of the test images T1 to T3 in the QuickBird scene in Hangzhou, China and the test image T4 in the WorldView scene
in Xuzhou, China.
464
June 2015
PHOTOGRAMMETRIC ENGINEERING & REMOTE SENSING


