It is possible to detect common views and remarkable dif-
ferences between the two users in terms of their sensitivity to
misclassification. For example, classes 11-Urban fabric and
14-Artificial, non-agriculture vegetated areas are relatively
similar for both users (w ~0.9). Therefore, if these two classes
are mixed within an under-segmented object, the thematic
quality of that object will nevertheless stay relatively high
for both users. On contrary, classes 11-Urban fabric and
42-Maritime wetlands are considered very differently. These
classes are relatively similar for a wolf researcher (w = 0.8)
and relatively different for a general user (w ~0.2). While
many people would agree that classes 11 and 42 are very dif-
ferent because one is an anthropogenic environment built-up
of impervious materials and the other is dominated by water
and vegetation, a wolf researcher sees it differently because
a wolf would not use either class as habitat. Therefore, the
T
able
1. T
hematic
S
imilarity
B
etween
the
C
lasses
of
CLC2006 (L
evel
2) A
ccording
to
a
W
olf
R
esearcher
;
F
irst
R
ow
and
C
olumn
I
ndicate
the
C
ode
of
the
L
and
C
over
C
lasses
described
in
P
late
1
11
12
13
14
21
22
24
31
32
33
42
5
11
0.950
12
0.900 0.933
13
0.900 0.900 1.000
14
0.900 0.900 0.900 1.000
21
0.300 0.300 0.300 0.300 0.950
22
0.300 0.300 0.300 0.300 0.900 1.000
24
0.300 0.300 0.300 0.300 0.300 0.300 0.933
31
0.100 0.100 0.100 0.100 0.200 0.200 0.133 0.867
32
0.167 0.167 0.167 0.167 0.217 0.217 0.167 0.583 0.622
33
0.488 0.488 0.488 0.488 0.513 0.513 0.200 0.138 0.154 0.438
42
0.800 0.800 0.800 0.800 0.800 0.800 0.137 0.100 0.100 0.450 1.000
5
0.450 0.450 0.450 0.450 0.300 0.300 0.183 0.100 0.100 0.250 0.700 0.750
T
able
2. T
hematic
S
imilarity
B
etween
the
C
lasses
of
CLC2006 (L
evel
2) A
ccording
to
a
G
eneral
U
ser
.
F
irst
R
ow
and
C
olumn
I
ndicate
the
C
ode
of
the
L
and
C
over
C
lasses
D
escribed
in
P
late
1
11
12
13
14
21
22
24
31
32
33
42
5
11
1.000
12
0.762 1.000
13
0.857 0.810 1.000
14
0.893 0.667 0.643 1.000
21
0.571 0.429 0.286 0.429 1.000
22
0.643 0.429 0.286 0.429 0.643 1.000
24
0.774 0.563 0.405 0.548 0.905 0.905 1.000
31
0.357 0.262 0.143 0.571 0.214 0.286 0.579 0.968
32
0.381 0.286 0.167 0.571 0.310 0.50
0.627 0.643 0.984
33
0.429 0.333 0.250 0.536 0.366 0.536 0.649 0.571 0.804 1.000
42
0.214 0.119 0.000 0.214 0.214 0.214 0.452 0.214 0.476 0.446 1.000
5
0.393 0.310 0.179 0.429 0.250 0.250 0.464 0.179 0.179 0.339 0.821 0.929
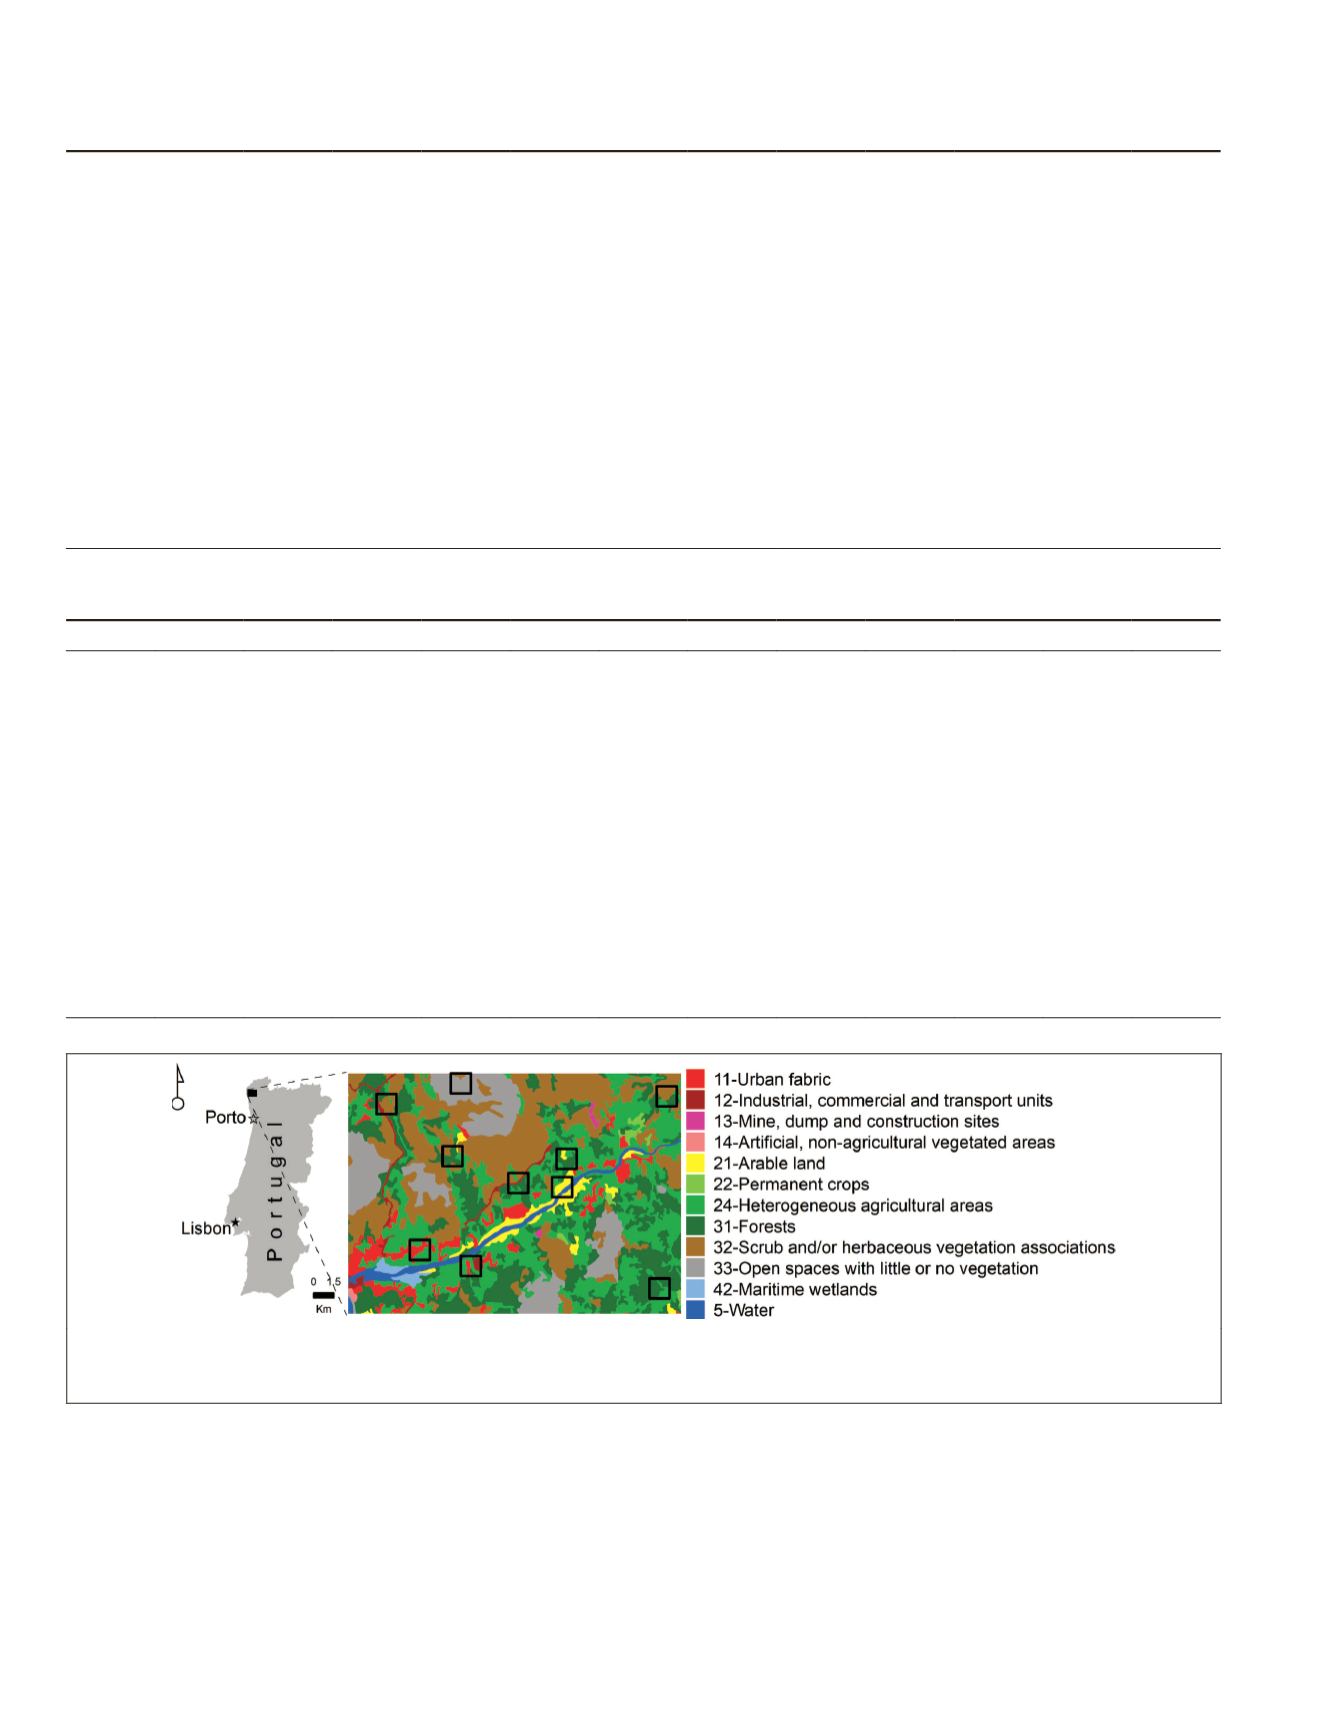
Plate 1. Study area in northern Portugal (24.9 km × 18 km, central coordinates are 41.7471°N, 8.68073°W), reference data used
(CLC2006, level 2 of nomenclature) and a random sample used in image segmentation assessment and classification (squared areas,
outlined in black).
456
June 2015
PHOTOGRAMMETRIC ENGINEERING & REMOTE SENSING


