2WV2 Panchromatic, Red, and NIR1 Bands and DSM (PAN-R-NIR1-DSM
Method)
Mangroves often appear very dense and spatially heteroge-
neous without considerable tree height differences between
neighboring trees. However, underlying height values and
variations can be used to extract individual tree crowns with
object based image analysis (
GEOBIA
). The aerial photography
derived
DSM
was incorporated into the
PAN-R-NIR
1 method
to investigate the possibility of further improvements of the
shapes of tree crowns using actual height variations. Treetops
were detected by searching local maxima in the
DSM
. Because
of the limited height variations of mangrove trees between
neighboring trees, in addition to their densely clustered na-
ture, spectral information of the panchromatic band of the
WV
2
image was also incorporated for tree top detection. As some
mangrove species appear to have multiple treetops due to the
complex nature of their branches (multiple upward point-
ing branches), all treetops that were less than 3 m apart were
identified as false tree tops. This 3 m control distance was
chosen in congruence with the average distance between two
trees according to the field observations. After that, an iterative
process of region growing from these treetops was introduced
to delineate crown boundaries. Two control parameters were
used to limit the crown boundary growing. One was the ratio
of the
NIR
1 band value of the tree top object to neighboring ob-
jects, and the other one was the height difference between the
treetop object and the edge of the crown. It was assumed that
the maximum height of tree crowns was about 2 m. Finally, a
morphology analysis was done to re-shape the isolated crowns.
The Inverse Watershed Segmentation (
IWS
) Method with the
DSM
To apply the
IWS
method, the
DSM
that did not undergo low
pass filtering was used. First, the
DSM
was inverted, which
resulted in turning the treetops upside down into depres-
sions or ponds. Tree branches and crown boundaries therefore
became watersheds. The local minimum values (pour points)
were then detected and classified as tree tops. Small imper-
fections (a pixel or set of pixels whose flow direction is un-
defined) in any digital surface model are called sinks (ArcGIS
Resources - Esri, 2012). Once the sinks were identified from
the inverted surface model, they needed to be filled to gener-
ate the flow directions. The watersheds were based on these
flow directions and positions of treetops. Finally, watersheds
were converted to polygons assuming that they represented
tree crowns.
Accuracy Assessment
The quality of image segmentation is largely based on the
quality of the source data, especially the radiometric, spatial,
and spectral resolutions, in addition to optimal selection of
parameter values for the segmentation. A meaningful rule set
then enables adaptation of the segmentation results correctly
based on target objects. However, to identify the best segmen-
tation method and corresponding data source for mangrove
tree crown isolation, a goodness of polygon matching method
described by Clinton
et al
. (2010) was used. This calculates
OverSegmentation, UnderSegmentation, and the closeness in-
dex (D), which explains the closeness in the two dimensional
space defined by both OverSegmentation and UnderSegmen-
tation. OverSegmentation (correctness) and UnderSegmenta-
tion (completeness) indicate the inaccuracies associated with
too many or too few segments (Moller
et al
., 2007; Zhan
et al
.,
2005). In addition, they are in the range of [0, 1] where zero
represents the perfect segmentation. The closeness (distance)
index D is in the range of [0, 2
1/2
].
Validation data were collected by manually digitizing 268
tree crown boundaries using the Stereo Analyst module in
ERDAS Imagine
®
software. This included 56 field surveyed
tree locations as well. In order to assess the potential of man-
grove tree crown delineation from high resolution remotely
sensed data, OverSegmentation, UnderSegmentation, and the
closeness indices were calculated.
Results
The Rapid Creek mangrove forest has some areas with ho-
mogeneous mangrove species, and some areas with a more
heterogeneous mix. There are five commonly found mangrove
species:
Avicennia marina
,
Ceriops tagal
,
Bruguiera exaristata
,
Lumnitzera racemosa
, and
Rhizophora stylosa
(Heenkenda
et al
.,
2014). Although
Excoecaria ovalis
, and
Aegialitis annulata
can
also be recognized, their coverage is relatively limited. Field ob-
servations determined that an average distance between two trees
is about 3 m and an average radius of tree crowns is about 1.5 m.
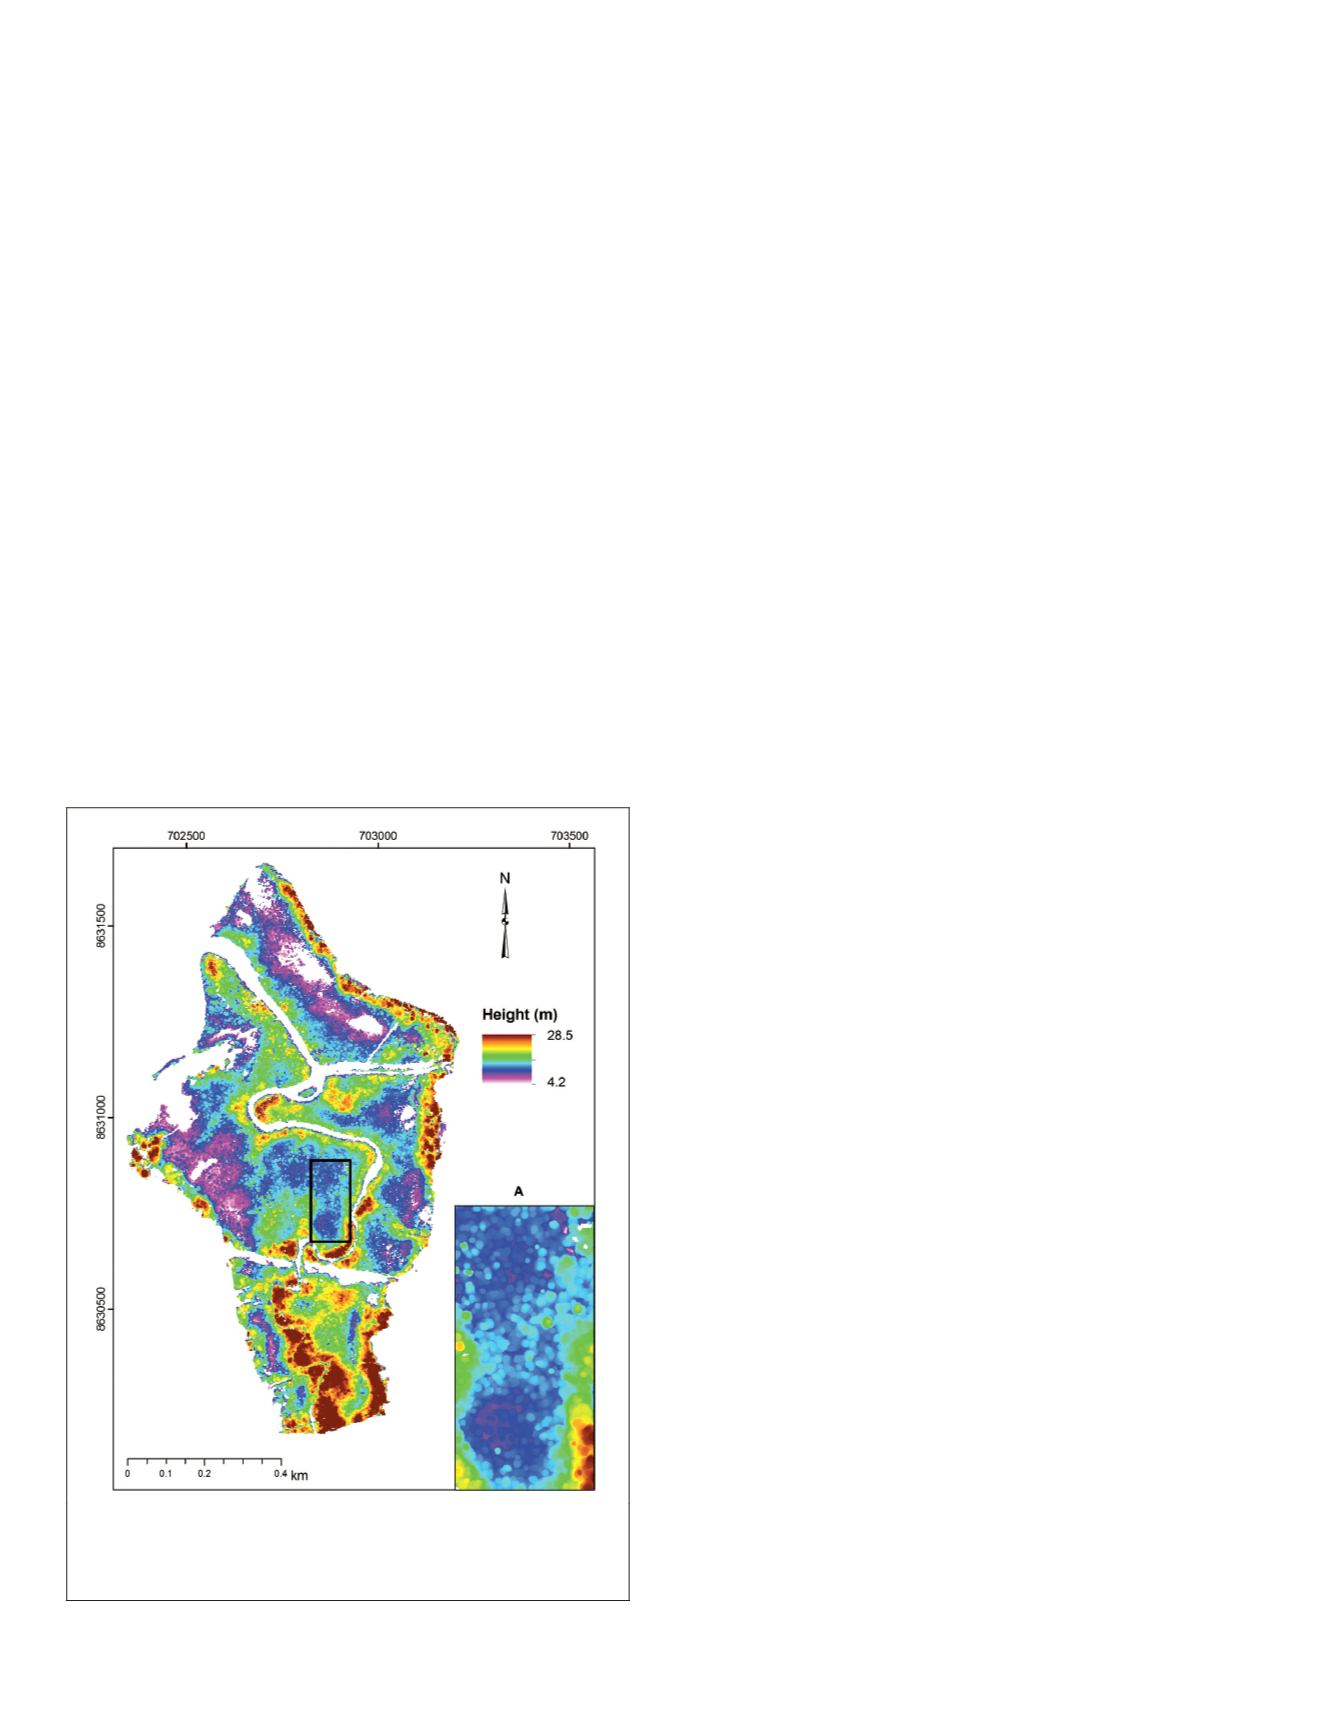
The Digital Surface Model
The digital surface model (
DSM
) created for the Rapid Creek
mangrove forest is shown in Plate 2. The horizontal accuracy
of the
DSM
is approximately 0.15 m compared to the ground
control points. The vertical accuracy is about 0.2 m with re-
spect to field measurements of tree heights. The
DSM
showed
localized circular patterns throughout (mostly corresponding
to mangrove tree crowns (Plate 2-inset A) highlighted by the
application of the focal statistics function.
Mangrove Tree Crown Delineation
WV2 Panchromatic, Red, and NIR1 Bands (PAN-R-NIR1 Method)
Mangrove tree crowns extracted with the
PANRNIR
1 method
are shown in Plate 3a. Some of the polygons represent ag-
gregated trees rather than single trees. Successful detection
of maximum brightness values representing treetops in the
Plate 2. The digital surface model of the Rapid Creek mangrove
forest created from aerial photographs. Inset “A” shows local-
ized circular patterns due to the image enhancement using focal
statistics function in ArcGIS.
474
June 2015
PHOTOGRAMMETRIC ENGINEERING & REMOTE SENSING


