image is evident when polygons are overlaid with the pan-
chromatic image (Plate 4a). However, smooth crown bound-
aries cannot be perceived. Also, gaps exist between crown
boundaries obtained from the
PAN-R-NIR1
method, though the
mangrove forest is very dense by nature.
(a)
(b)
(c)
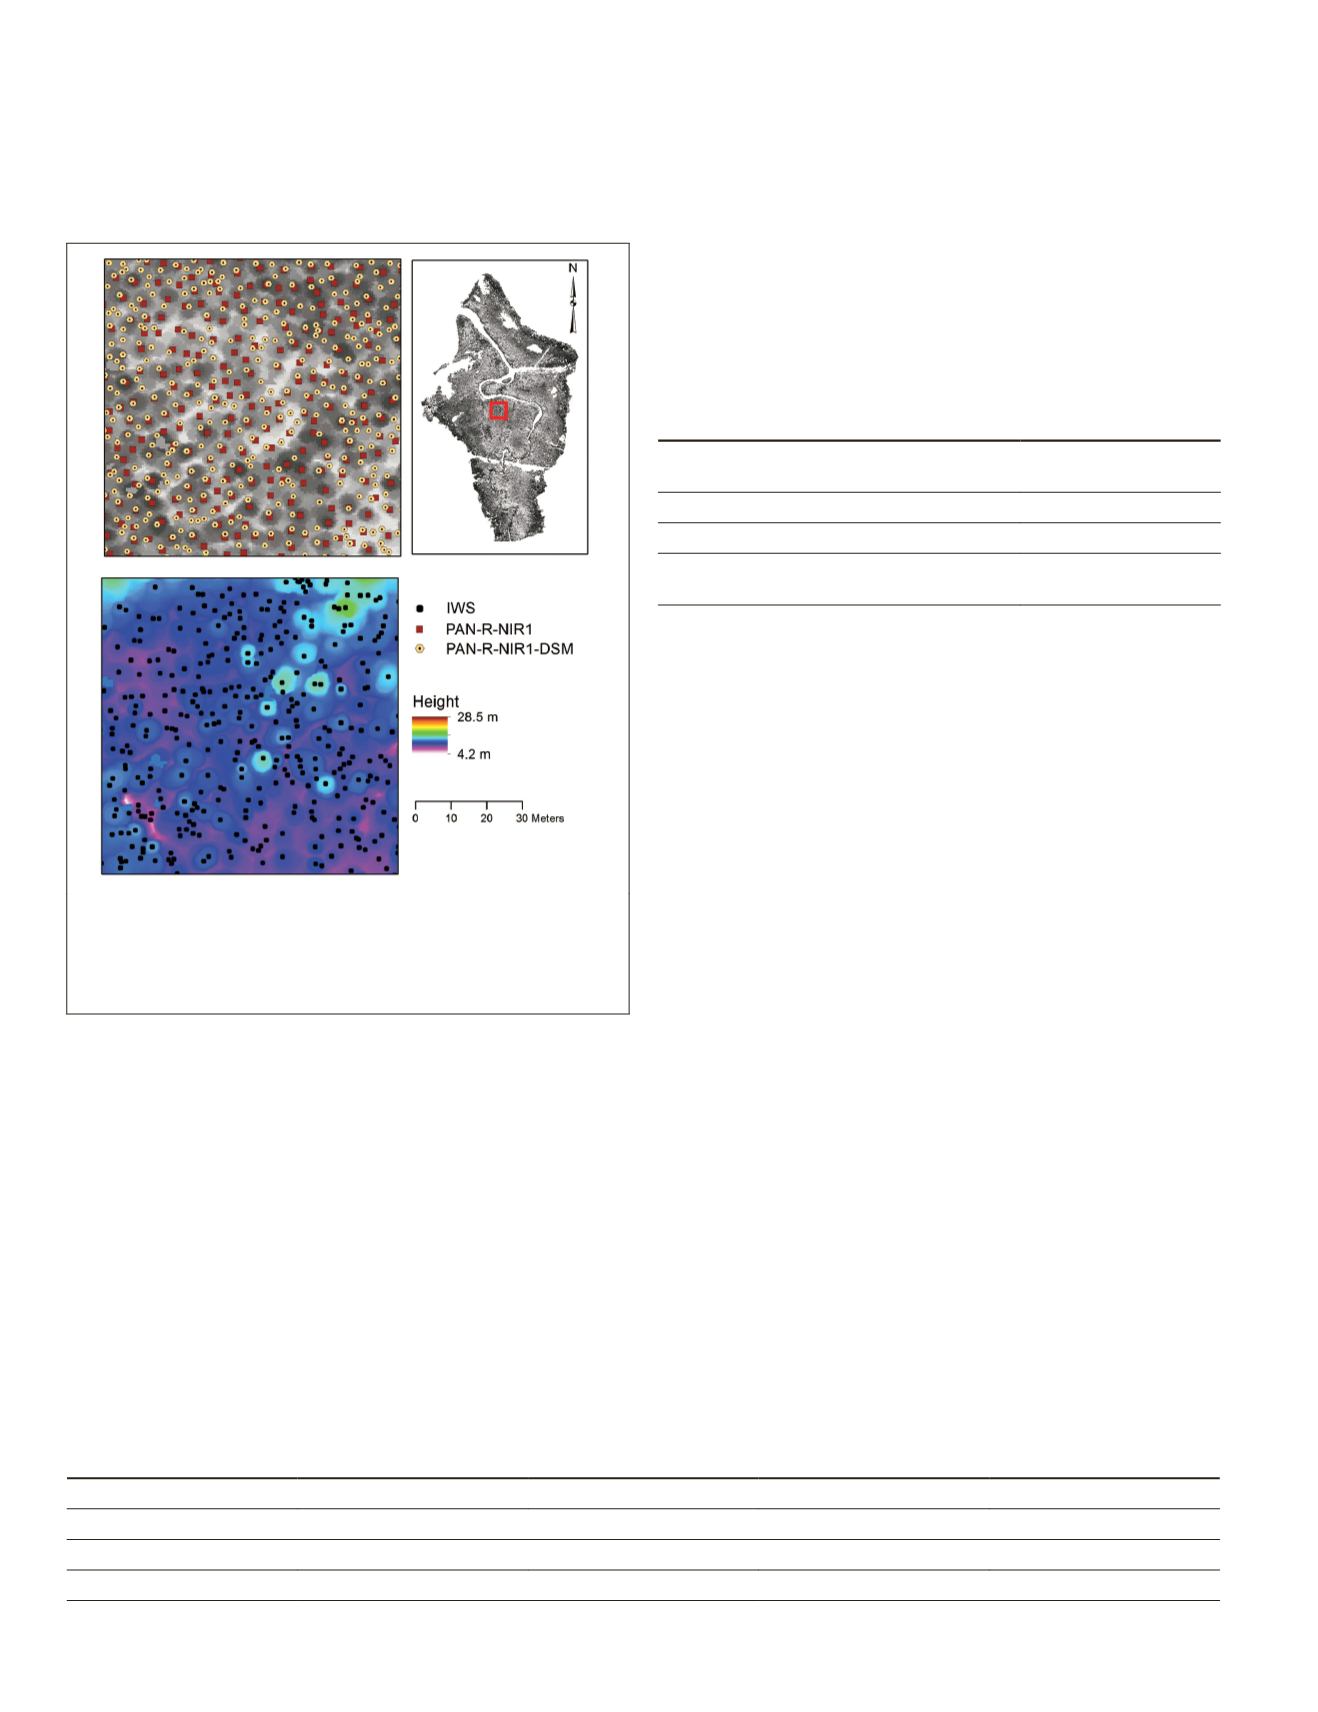
Plate 4. (a) Centroid positions obtained from the
pan
-
r
-
nir
1 and
the
panrnir
1
dsm
methods overlaid with the panchromatic
wv
2
image with low pass filtering applied; (b) Overview of the Rapid
Creek mangrove forest; and (c) Centroid positions obtained from
the
iws
method overlaid with the
dsm
.
WV2 Panchromatic, Red, and NIR1 Bands and DSM (PAN-R-NIR1-DSM
Method)
Plate 3c and 3d illustrate the tree crowns delineated using the
PAN-R-NIR1
-
DSM
method overlaid with the panchromatic image
and the
DSM
, respectively. Once the
DSM
was incorporated,
shapes of the canopies were improved dramatically. When
overlaid with the
DSM
, it can be seen that there are some
clusters of mangrove trees detected rather than individuals
(Plate 3d). Extents of the gaps between tree canopies are less
obvious than the
PAN-R-NIR1
method.
The Inverse Watershed Segmentation (IWS) Method with the DSM
The
IWS
method mainly detected clusters of tree canopies
with similar heights, rather than individuals. Plates 3e and
3f show the delineated mangrove tree clusters and initially
extracted tree tops overlaid with the panchromatic image and
the
DSM
, respectively. Most of the neighboring treetops were
merged together to form a single crown. The
DSM
showed that
there was no significant range in height differences within
tree clusters (Plate 3f).
Table 2 shows the number of objects extracted as tree tops
using each method. The number of objects extracted using the
PAN-R-NIR1-DSM
method reported the highest number and from
the
PAN-R-NIR
1 method reported the lowest number. The differ-
ence between these two methods was approximately 11,500
objects. The
IWS
method extracted 8767 more objects than the
PAN-R-NIR
1 method.
T
able
2. T
he
N
umber
of
O
bjects
E
xtracted
as
T
reetops
U
sing
T
hree
D
ifferent
M
ethods
Method
No. of objects
extracted as tree tops
WV2 image only (PAN-R-NIR1)
21,027
WV2 image and DSM (PAN-R-NIR1-DSM)
32,789
Inverse Watershed Segmentation
method (IWS)
29,794
The centroid positions of tree crowns obtained for part of
the mangrove forest is shown in Plate 4. All the centroid posi-
tions of the
PAN-R-NIR
1 method are very close (i.e., they occur
at the same location) to the corresponding positions from
PAN-
R-NIR1-DSM
method (Plate 4a). This is because the
PAN-R-NIR
1
method detected the highest brightness values of the images
as treetops, while the
PAN-R-NIR1-DSM
method identified both
the highest brightness and height values as treetops. When
creating the watershed from the inverted surface model, most
of the tree crowns that had small height differences within
their neighborhood were clustered together resulting a single
tree crown (Plate 3f).
Accuracy Assessment
The visual appearance of the results obtained with the
PAN-
R-NIR1-DSM
method is the one closest to reality. Most of the
tree crowns that have reasonable height variations between
neighboring trees have successfully been detected. The crown
boundaries were smoother than two other methods. Although
the tree crowns obtained with the
PAN-R-NIR1
method detected
treetops quite successfully, crown boundaries had a distinc-
tive jagged shape representing the pixel size of the image
bands. However, this was quite different when considering
PAN-R-NIR1-DSM
method. The integration of the high spatial
resolution
DSM
significantly improved shapes of the crown
boundaries. Although the
IWS
method detected a number of
treetops closer to the one detected from the
PAN-R-NIR1-DSM
method (Table 2), it was not possible to delineate the same
amount of tree crowns after processing the surface raster.
The distribution of validation dataset:
in-situ
surveyed
and on-screen digitized tree crowns is shown in Plate 1.
Table 3 shows the calculated statistical values for different
GEOBIA
approaches. Tree crowns delineated from the
PAN-R-
NIR1-DSM
method resulted in the most successful closeness
index of 0.11 (relative accuracy of 92 percent) followed by the
T
able
3. A C
omparison
of
A
ccuracies
of
E
xtracted
T
ree
C
rowns
:
the
P
ossible
R
ange
of
B
oth
O
ver
S
egmentation
and
U
nder
S
egmentation
V
alues
is
[0,1]
where
Z
ero
D
efines
the
P
erfect
S
egmentation
;
the
V
alues
C
loser
to
Z
ero
for
“C
loseness
I
ndex
” I
llustrate
the
C
loseness
of
M
angrove
T
ree
C
rowns
in
T
wo
-D
imen
-
sional
S
pace which
is
D
efined
by
O
ver
S
egmentation
and
U
nder
S
egmentation
to
V
alidation
C
rowns
(C
linton
et
al
., 2010)
Method
OverSegmentation
UnderSegmentation
Closeness index
Overall relative accuracy
PAN-R-NIR1
0.15
0.02
0.15
89%
PAN-R-NIR1-DSM
0.11
0.02
0.11
92%
IWS
0.02
0.94
0.94
35%
476
June 2015
PHOTOGRAMMETRIC ENGINEERING & REMOTE SENSING


