For the indices (
NDVI
,
BAI
), the similarity function
S
(
d
c
) is
defined with the help of the mean value
m
c
and the standard
deviation
σ
c
:
S d
d m
when d m
S d inalltheothe
c
c
c
c
c
c
c
c
( )
,
( ) ,
= −
−
≤ − ≤
=
1
0
0
σ
σ
r cases
.
(4)
According to the above Equation 1, any object with an
index value within the limits specified by the mean and
standard deviation of the index for the corresponding class,
has a degree of spectral similarity between 0 (no building) and
1 (building). The objects with an index value outside those
limits have zero similarity to a building class. Consequently,
the objects with an index value close to mean value of the
index are objects with high similarity to building class. The
rules based on geometry are defined in the same way, and the
comparison of the objects’ shape is based on the geometrical
attributes. The similarity function is set according to the
mean values and the standard deviation:
S g
g m
when g m
S g
inalltheothe
c
c
c
c
c
c
c
c
( )
,
( ) ,
= −
−
≤ − ≤
=
1
0
0
σ
σ
r cases
.
(5)
Similar to what was described above for the indices’
values; the values of the geometrical attributes close to mean
value of the geometrical attribute for the building sub-class
have high similarity to the corresponding sub-class.
Extraction of New Buildings
The rules for the new buildings detection are set in such a way
as to eliminate initially the areas that were not likely to be
changes and then to analyze only the remaining objects. The
possible change locations are defined by analyzing the map
and image information with the help of the attributes resulted
from the training process. The vegetated areas are the first to be
excluded from further processing, and they are detected based
on
NDVI
values. Therefore, the objects with a possibility to be
new buildings are: (a) image objects that do not correspond to
roads and buildings on the existing map, and (b) image objects
that are not classified as vegetated areas. The change detection
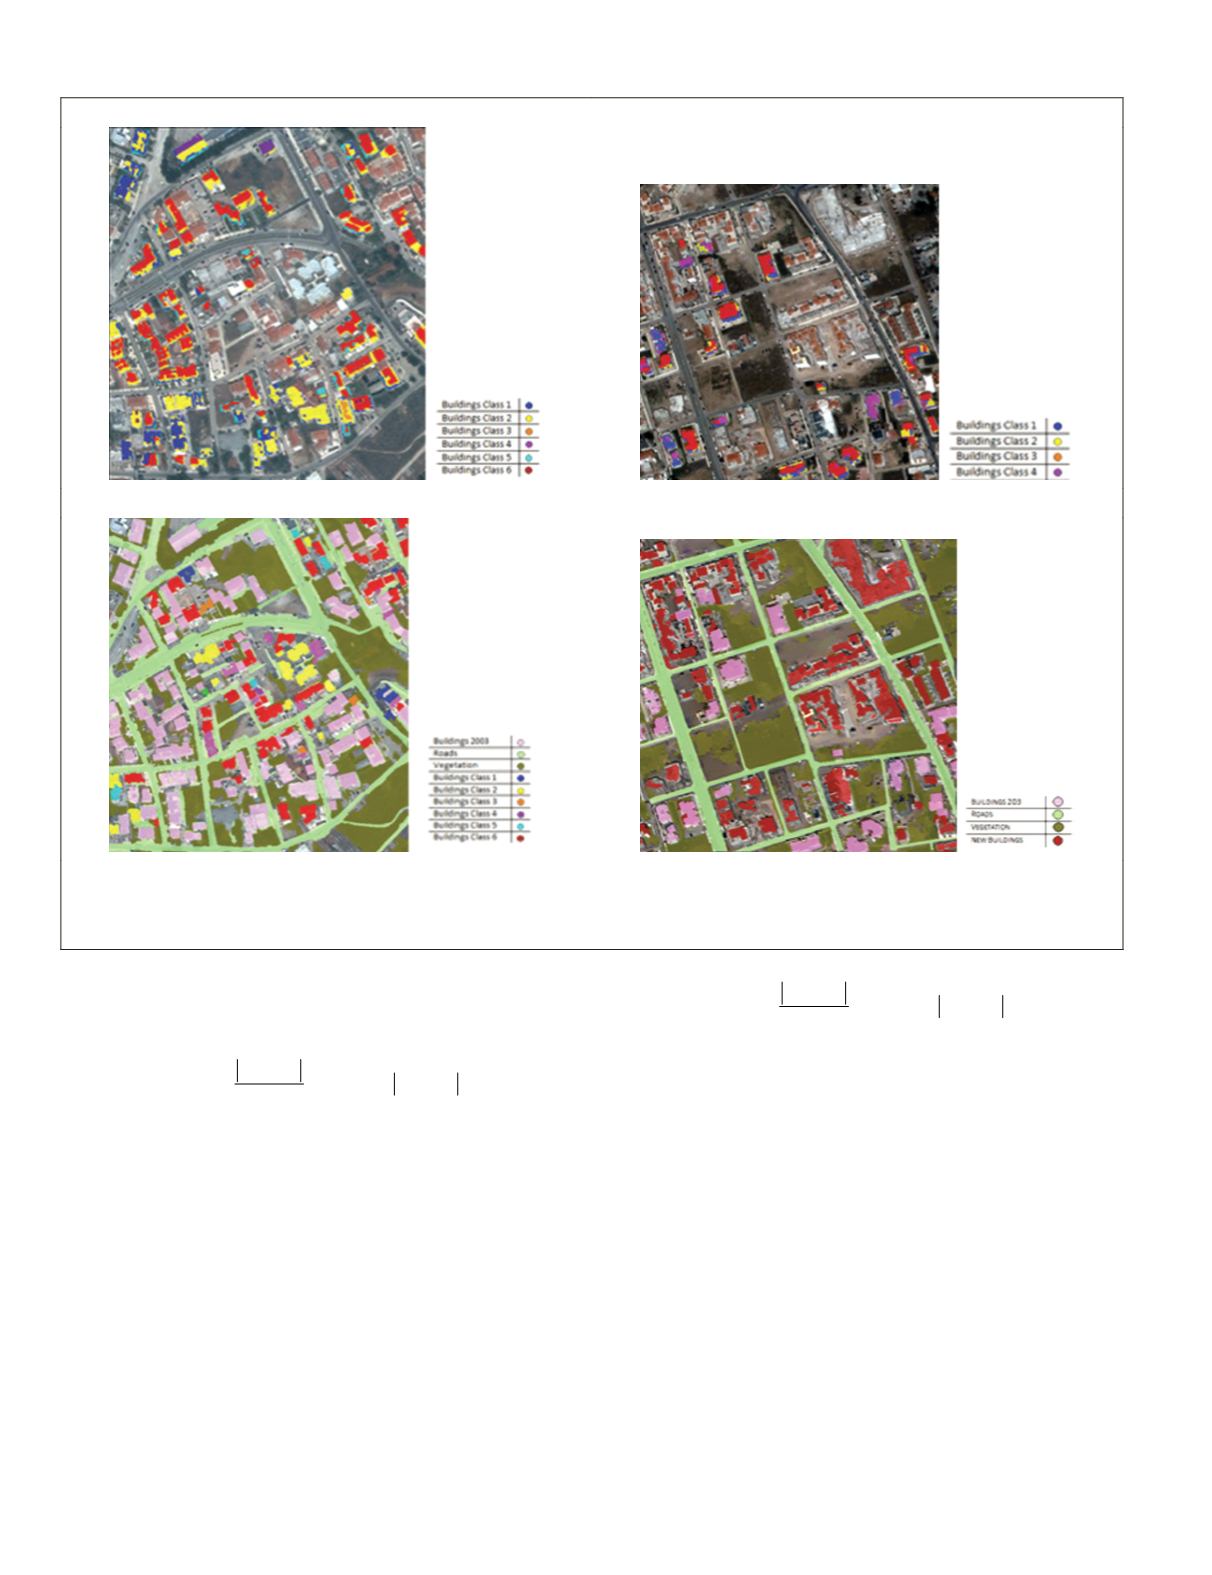
BUILDING SUB-CLASSES IN PYLAIA (2003)
BUILDING SUB-CLASSES IN KALAMARIA (2003)
BUILDING CHANGE DETECTION IN PYLAIA
BUILDING CHANGE DETECTION IN KALAMARIA
Plate 1. Detected building sub-classes based on the unsupervised classification procedure for (a) Pylaia [2003], and (b) Kalamaria
[2003]. The optimal number of clusters has been estimated, i.e., six for the Pylaia study area and four for Kalamaria. The detected
building sub-classes that exist on the available map are presented in different colors. The detected changes after the application of the
developed knowledge-based classification procedure for (c) Pylaia, and (d) Kalamaria.
486
June 2015
PHOTOGRAMMETRIC ENGINEERING & REMOTE SENSING


