analysis is performed by applying mainly the following fuzzy
logic rules successively on the objects detected in each step:
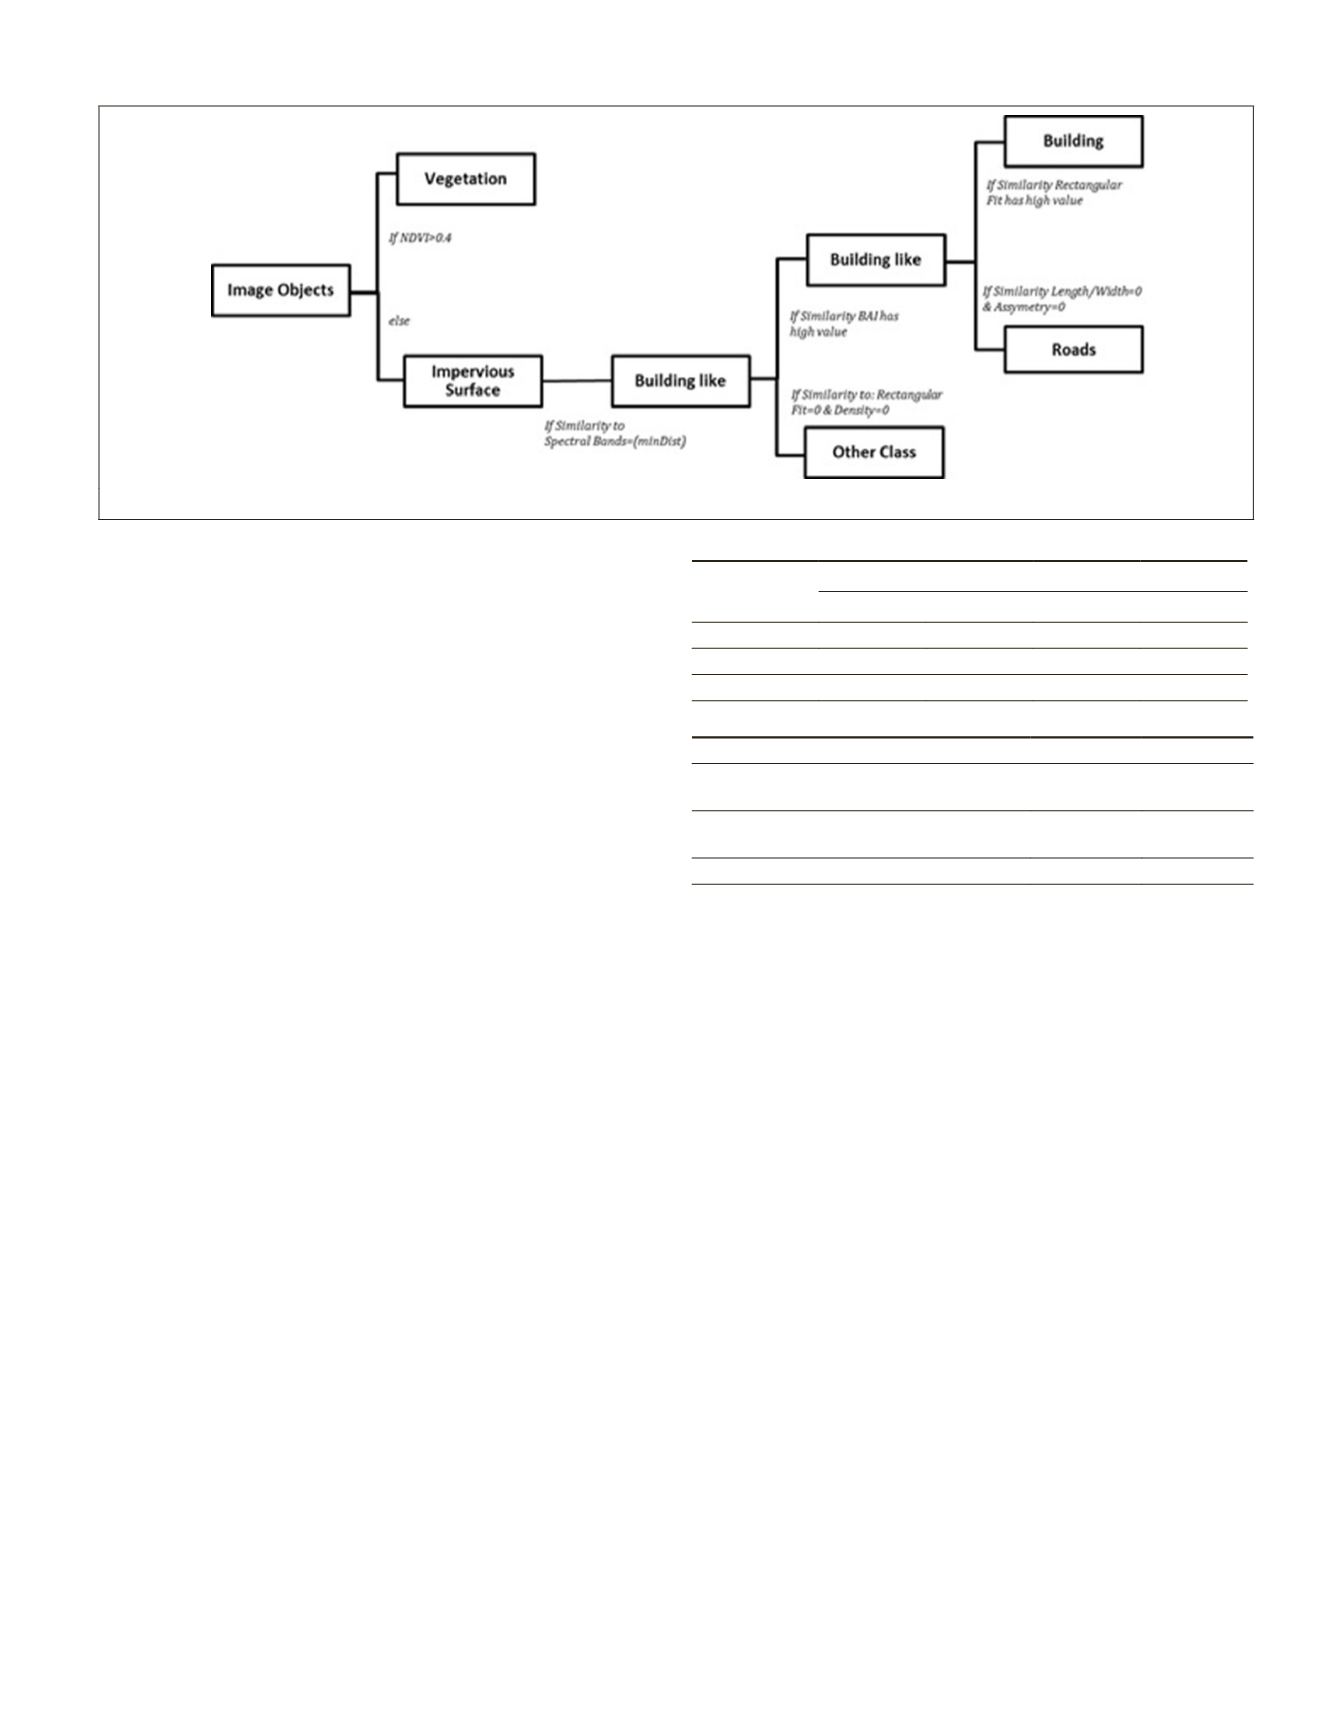
• If the spectral similarity of an object to one building
sub-class is high (minimum Euclidean distance), then
this object probably corresponds to a new building.
• If an object has high spectral similarity (values close
to zero) concerning the attribute
BAI
, then this object is
more probable to be a new building.
• If an object has zero value for the similarity function
concerning the attributes
Rectangular Fit
and
Density
,
then this object is not a building, and it is excluded
from further analysis.
• If an object has zero value for the similarity function
concerning the attributes
Length/Width
and
Asymme-
try
, then this object is not building, and it is probably
part of the road network
• If an object has high value for the similarity function
concerning the attribute
Rectangular Fit
, then this
object is most likely to be a building.
Having implemented the above rules (Figure 5) during
our experiments, the main parts of most new buildings have
been detected, and only some unclassified ones still remain.
Therefore, certain rules have been implemented for the
detection of new buildings as they differ from the ones of the
geodatabase, and they could not be described properly from
the existing information. In this case the rules are not based
on the similarity functions, but they concern the spectral
attribute of built-up areas index (
BAI
), the shape attributes of
Rectangular Fit and Density and the contextual attribute of
Relative Border to class buildings. The experimental results
after the application of the multilevel knowledge-based
classification rules are presented in Plate 1.
Experimental Results and Evaluation
Assessing the Spatial Transferability
The proposed building change detection procedure was eval-
uated its standardization and reproduction potential. Certain
experimental results, color illustration, and supplementary
material can be found at
/
Doxani_etal_2015_PERS.html
.
As it is described in Figure 1, the image segmentation task
was the first step of the analysis. The second part involved
the learning phase through the integration of the image
objects and the vector information from the existing data-
base. In particular, the demolished buildings were the first
to be identified according to the rules of the
Definition of the
Training Objects Subsection.
The object attributes were then
calculated for every building sub-class as they were derived
from the
FMLE
clustering. While in the first study area the
optimal number of classes for the unsupervised clustering
was calculated to six, in the second study area, which was the
Kalamaria suburb in the City of Thessaloniki, the clustering
analysis indicated that the optimal number was four (Plate 1).
Regions that were not belonging in the existing buildings,
roads, and vegetation, were first identified and they were
omitted from the following processing steps. The change
detection rules, which are defined in the
Extraction of New
Buildings Subsection
, were then applied. For certain spectral
attributes a minor parameter tuning was required. The sub-
classes were then merged to one class towards the accurate
building change detection and the efficient implementation
of the rule set. In particular, in this case there were not many
single buildings constructed in the region, and the changes
mainly referred to new buildings and building sections that
were attached to existing structures.
Quantitative Performance Evaluation
The quantitative and qualitative evaluation of the proposed
change detection scheme was performed based on the ancil-
lary ground truth data. The quantitative evaluation (Table
2) was performed initially by employing the standard pixel-
based, performance evaluation measures of detection com-
pleteness, correctness, and overall quality (Champion
et al
.,
2010; Ozdemir
et al
., 2010; Doxani
et al
., 2012). Regarding the
object-based evaluation of the geometric accuracy (Table 3)
the resulting building objects were compared with the refer-
ence data by calculating the Euclidean distance (Zhan
et al
.,
2005) and the Modified Hausdorff distance, a recommended
measure for object matching evaluation (Dubuisson and Jain,
1994; Bouziani
et al
., 2010). The distance calculation is based
Figure 5. Certain rules from the knowledge-based classification procedure towards the detection of the new buildings.
T
able
2.Q
uantitative
P
erformance
E
valuation
Quantitative
measures
Object-based
Pixel-based
Pylaia Kalamaria Pylaia Kalamaria
Completeness
99% 95% 60% 52%
Correctness
96% 98% 88% 87%
Quality
95% 93% 55% 49%
T
able
3. O
bject
-
based
G
eometric
P
erformance
E
valuation
Object-based Geometric Measures
Pylaia Kalamaria
Mean Values of Euclidean distance
between polygon centroids (m)
3,3
5,3
Standard Deviation of Euclidean
distance between polygon centroids (m)
2,9
2,8
Modified Hausdorff Distance(m)
4,2
5,9
PHOTOGRAMMETRIC ENGINEERING & REMOTE SENSING
June 2015
487


