of image elements with an ontology. Data used included one
fused QuickBird image of a sub-urban residential area of east
Attica, Greece, taken in 2006. Before the extraction analysis,
the image was georeferenced.
Design of the Ontology
The aim was to represent domain knowledge (such as land
cover classes) and remote sensing knowledge (such as the
required indices for the definition of land cover classes) within
a
GEOBIA
ontology. The development began with the specifica-
tion phase (Paslaru
et al
. 2006; Brusa
et al
. 2006), where the
general concepts that were going to be described by the ontol-
ogy were determined. These concepts correspond to the land
use/land cover classes, present in the imagery (Figure 3).
Given that only spectral information was available for
building extraction and the majority of the rooftops appeared
relatively spectrally homogeneous and rectangular, it was
decided to extract the rooftops based on their spectral and
geometric signature.
In the conceptualization phase, the main concepts were for-
malized in an initial taxonomy, independently of any software
or language implementation along with the properties required
to define each class. As the taxonomy was related with the lev-
els of analysis, the number and parameters of the segmentation
levels were also approximately determined. The lower level
properties were determined based on remote sensing knowl-
edge, literature survey, and personal experimentation. Knowl-
edge formalization, the final step, involved the development
of a fuzzy
OWL
2 ontology, based on the theoretical scheme.
Through the formalization step, the theoretical scheme of the
ontology was refined, by a repeated trial and error process. In
the following, the extraction strategy is presented.
For the segmentation process the multi-resolution seg-
mentation algorithm included in Definiens eCognition
®
8.6
(Trimble, 2011) was employed. Any single or hierarchical
segmentation algorithm could be employed along with
SPOR
.
Segmentation results were exported from eCognition and
imported into PostgreSQL. To visualize the results of the
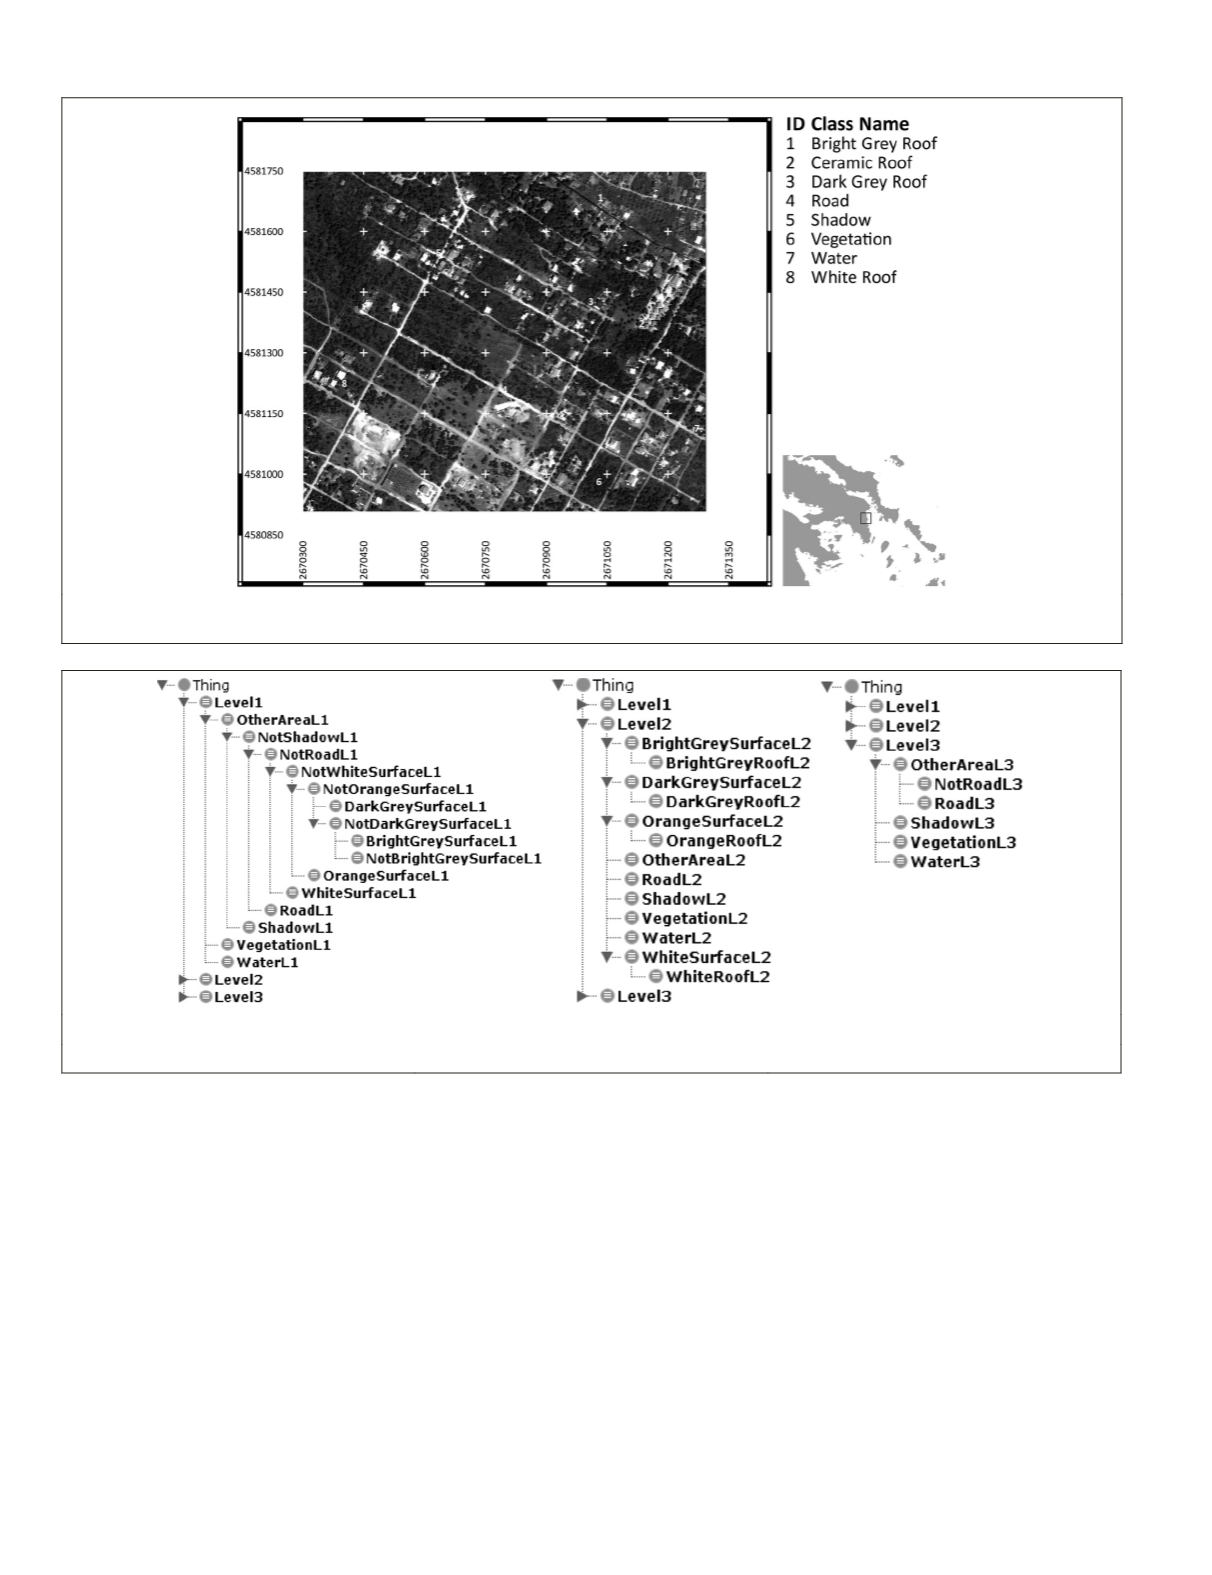
Figure 3. Examined categories in the area of study (QuickBird - Principal Component Analysis 1). Coordinates are presented in Greek
National Grid (EPSG 2100). (© QuickBird Image, Copyright 2006 Digital Globe USA).
(a)
(b)
(c)
Figure 4. Class hierarchies for (a) Level1, (b) Level 2, and (c) Level 3.
494
June 2015
PHOTOGRAMMETRIC ENGINEERING & REMOTE SENSING


