The comparison of the segmentation output (step 3) is
performed by employing features related to size and shape
and setting the following fuzzy rules:
i. If the difference of the objects’ area that belong to
existing buildings is in the range of 100 to 250 m
2
, then
these objects are probably changes;
ii. for those changed objects, if the distance between their
centers and the existing buildings is greater than zero,
then these segments are more certain to have been
changed; and
iii. if the relative area of the remaining changed objects
and the existing buildings is greater than 0.5, then
these objects are certainly part of a demolished
building (Figure 4).
It should be noted that the scale space filtering procedure
plays a significant role at this stage, as the delivered
meaningful objects facilitated considerably the comparison
process with the existing building database.
Extracting Object Attributes
The extraction of building spectral properties has been accom-
plished by calculating the attributes of the objects that are part
of the existing buildings, which are actually those remaining
after the exclusion of the demolished buildings. The challenge
here is to deal with the important spectral variation among
the urban objects. In particular, all the building objects, as
they are delineated by the polygons of the geodatabase, cannot
be regarded as a unique class e.g.,
building
. The main reason
for that, is on the one hand, the spectral variation among the
various roof types, i.e. tiled roofs, cement, etc., and on the
other hand, the depicted building facades due to the usual
off-nadir image acquisition. Moreover, the building rooftops
do not have uniform spectral reflectance values due to various
objects like chimneys, heating infrastructure, etc. Therefore,
all this variation should be treated in a different way and clus-
tered into different objects and building sub-classes. To this
end, we have employed an unsupervised clustering algorithm,
namely the Fuzzy Maximum Likelihood Estimation (
FMLE
)
as proposed by Gath and Geva (1989). The
FMLE
clustering
algorithm is able to deal with the problem of large variability
in cluster shapes, sizes, and densities, requiring a good ini-
tialization. Therefore, the initial cluster centroids have been
estimated by the fuzzy c-means algorithm and the optimal
fuzzy partition is performed by the
FMLE
algorithm.
Nevertheless, every clustering approach requires the proper
number of clusters to be defined by the user in each case study.
Therefore, towards automating the unsupervised clustering
procedure, a combination of validation indices should be
involved, concerning various measures, like compactness,
separability, fuzziness, etc. (Wang and Zhang, 2007). Bearing
that in mind, some indices are involved in the process
including the Fuzzy Hypervolume Validity (
FHV
) and the
Partition Density (
PD
), which are based on the fuzzy covariance
matrix of the cluster and the membership function values, the
Partition Coefficient (
PC
), which involves only the membership
values and defines the amount of “overlapping” between
clusters, the Partition Index (
SC
), which is the ratio of the sum
of compactness and separation of the clusters, the Separation
Index (S), which is similar to
SC
but divided by minimum-
distance separation and Xie and Beni’s Index (
XB
), which is the
ratio of the total variation within clusters and the separation
of clusters (Wang and Zhang, 2007). The multispectral bands
(B, G, R,
NIR
) and the built-up index are the input data for the
fuzzy clustering in our case study. A range of cluster numbers
(i.e., from 3 to 15) has been tested and the resulted optimal
value, the optimal number of clusters, based on the above
criteria is six for Pylaia study area (Plate 1). The following step
is to calculate the mean value and the standard deviation of the
spectral layers for each of the six building classes. However,
the building objects vary not only concerning the spectral
values but also the shape and the position. It was therefore
necessary to calculate the geometrical and the contextual
properties of the objects that belong to building sub-classes.
Knowledge-based Rules Set
The rules for detecting the new buildings are set by tak-
ing into account the spectral values, the geometry, and the
topology. The spectral similarity among the objects to be
analyzed, and the building classes of the model are defined
by calculating the spectral distance between the vector of
the object and the mean vector of the class. In particular the
Euclidean distance defines the similarity function among the
object to be analyzed and the building class
i
of the model:
( , )
(
)
d x m x m
i
i
i
= −
2
, where
x
is the object vector and
m
i
the
mean vector of the class
i
.
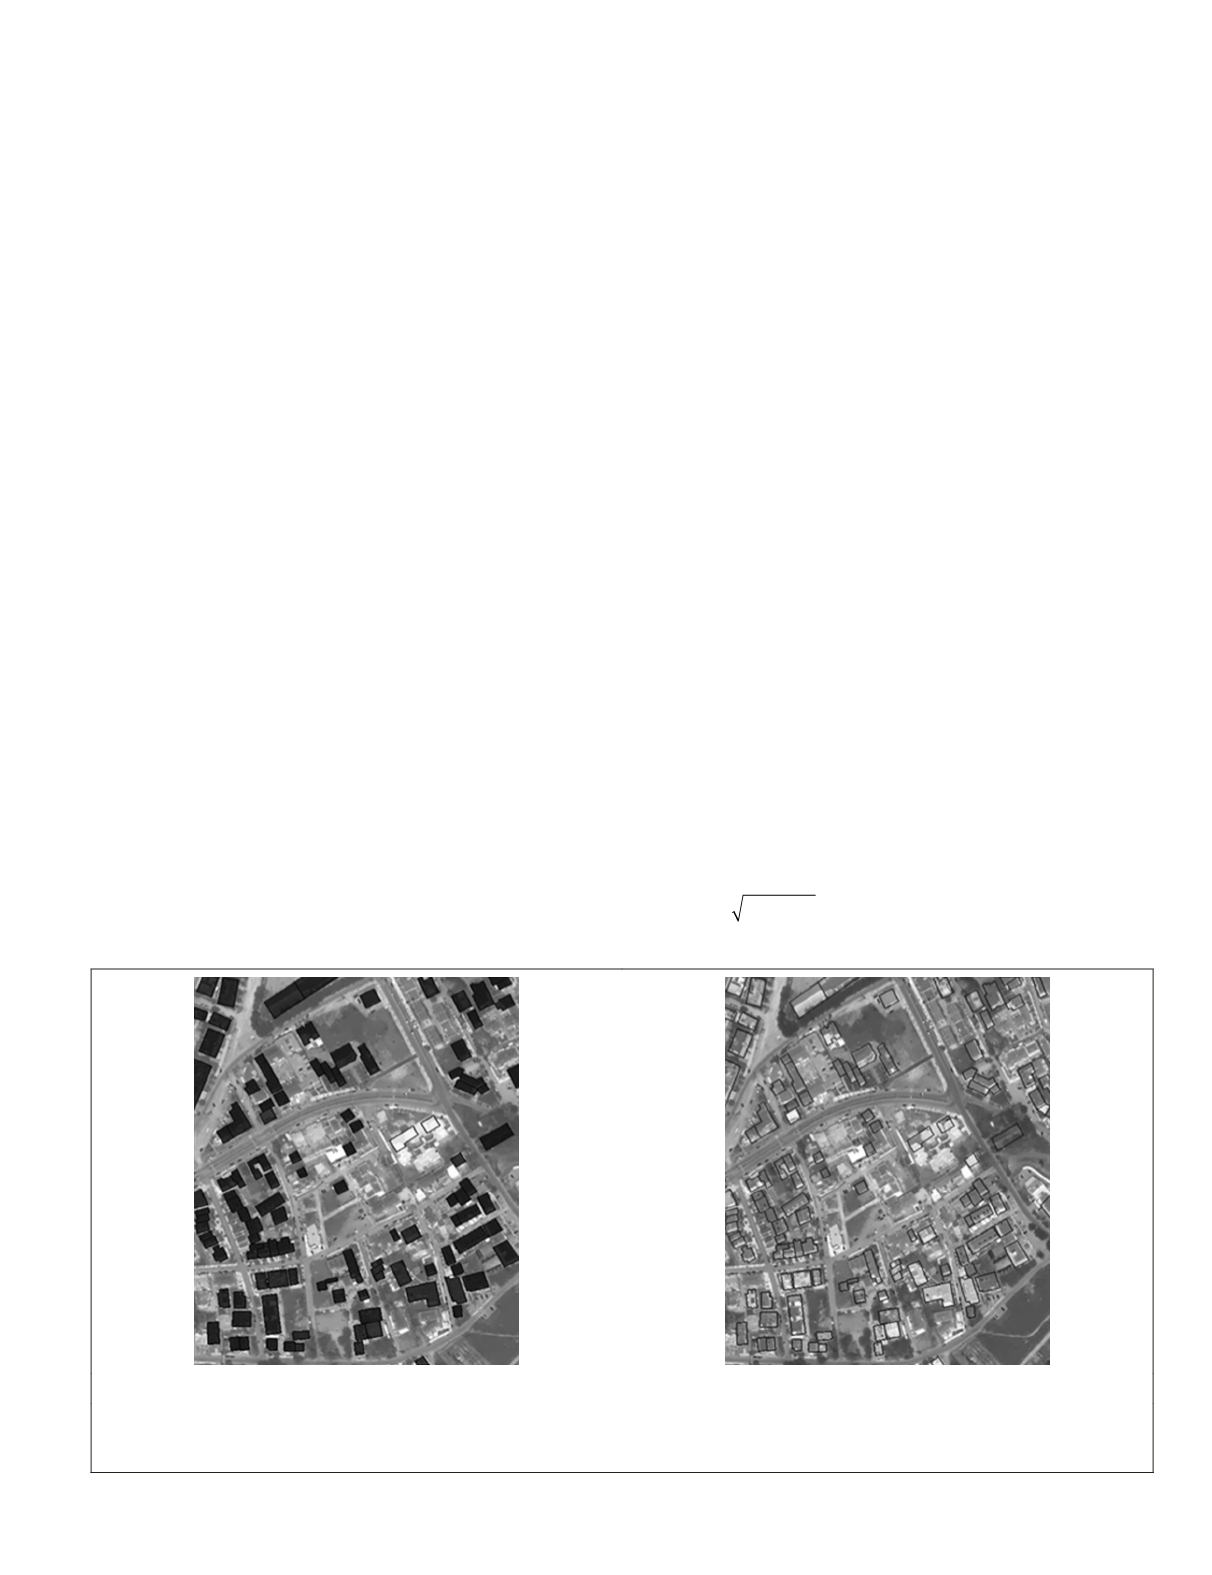
(a)
(b)
Figure 4. Selecting the appropriate training set for the learning procedure, (a) image objects after the image segmentation based on prior
information, and (b) the polygons that will not take place during the training procedure (in white color) are not accurately representing
building rooftops, in contrast to the other ones (in black color).
PHOTOGRAMMETRIC ENGINEERING & REMOTE SENSING
June 2015
485


