moderate forest vulnerability, and only 4 percent as high
forest vulnerability. More specifically, the ecological and
recreational values of forest systems (i.e., forest protected
areas and natural reserves), in addition to the actual extent of
forested areas within each cadastral unit, were the main fac-
tors contributing to an increased overall vulnerability.
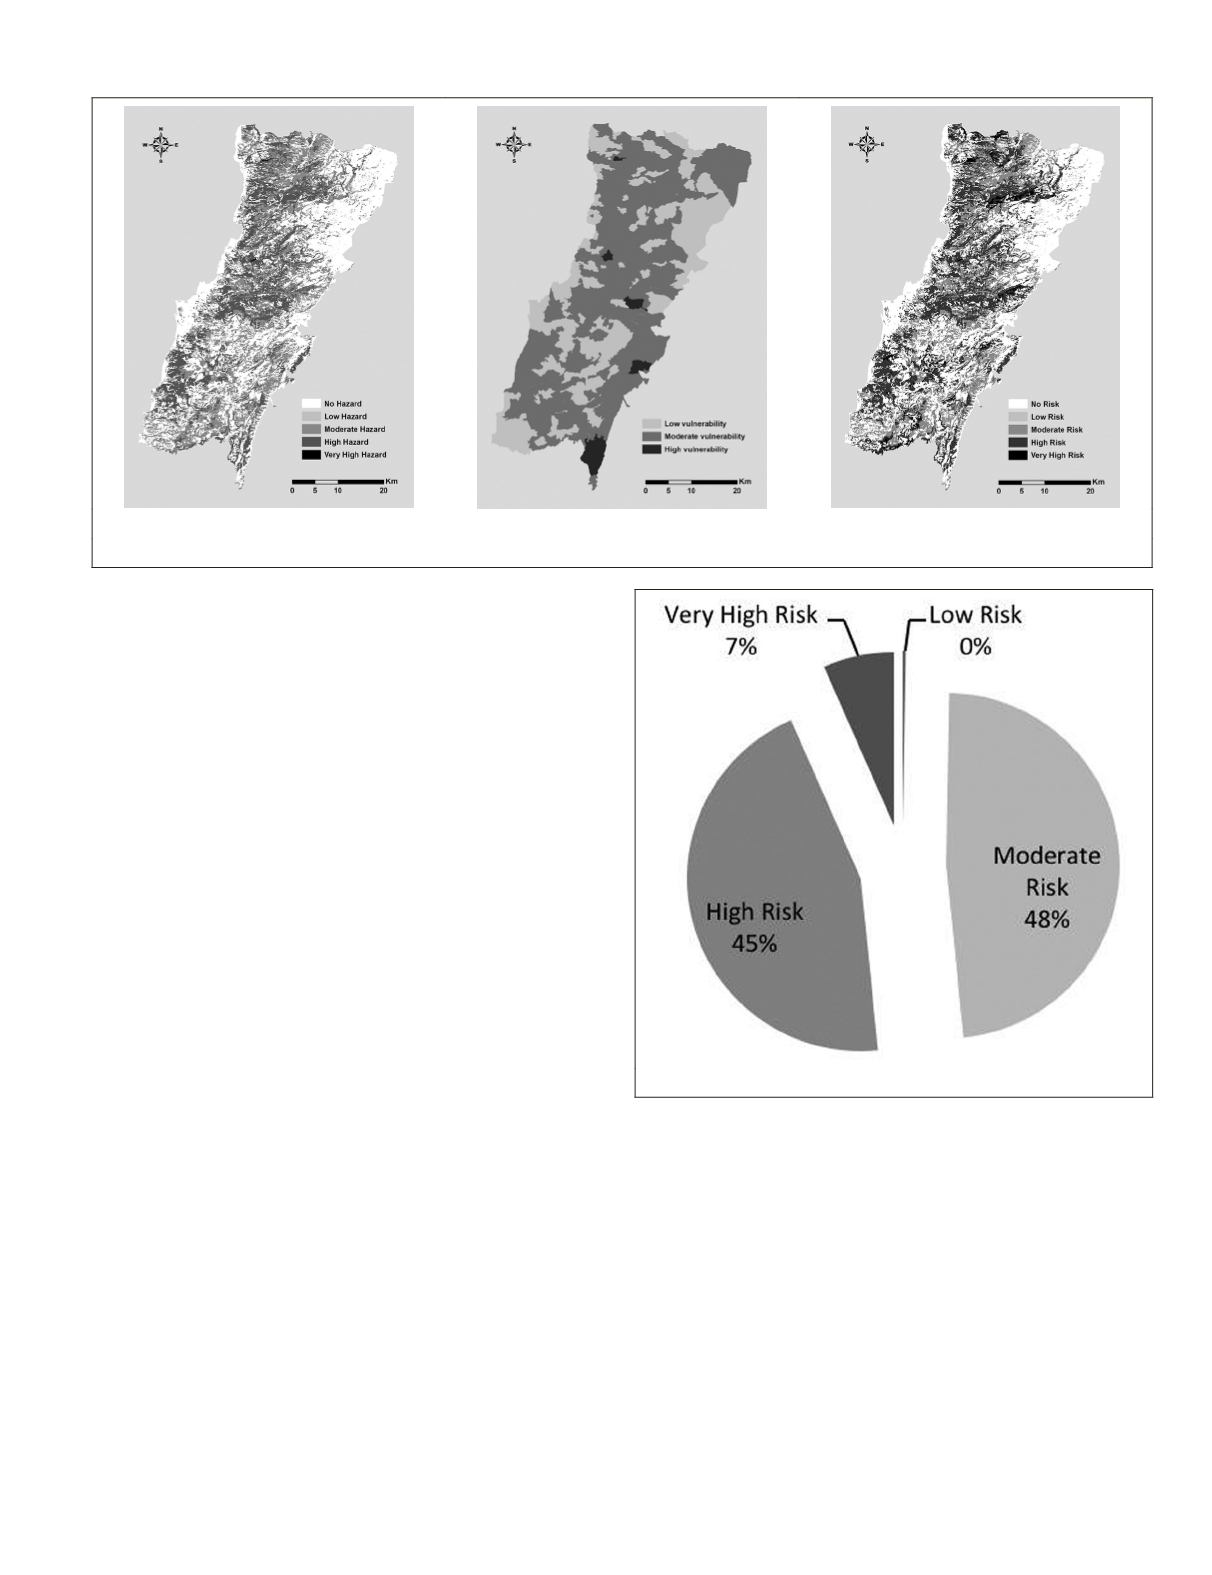
Finally, an overall fire risk map for Lebanon was derived
by combining wildfire hazard and vulnerability estimates
(Figure 5). A further investigation of the spatial distribution
of fire risk classes showed that most of the coastal area of
Lebanon was classified as “No risk.” This was mainly attrib-
uted to the dense urbanization of the coast and subsequent
lack of burnable and/or continuous fuels. The average eleva-
tions of areas classified as “Very High”, “High”, “Moderate”,
and “Low” risk were 672 meters, 768 meters, 953 meters, and
1608 meters above mean sea level, respectively. This was
mainly attributed to the availability, type, and density of fuel
in addition to the distribution of settlement along the moun-
tain slopes. In general fire prone dense forests (i.e.,
Quercus
calliprinos
and
Pinus brutia
) are found on lower altitude of
the western slopes of Mount Lebanon, while lower density
forests (i.e.,
Cedrus libani
,
Abies Cilicica
, and
Juniperus excelsa
)
are found at higher altitude. In addition, the unplanned urban
sprawl towards natural areas is increasing wildfire risk in the
Wildland-Urban Interface (
WUI
).
Overall, 45 percent of the vegetated area in the country
(excluding agricultural and built-up areas) was characterized
as having high risk of fire, whereas 48 percent of the vegetated
area was classified as having moderate risk of fire (Figure 6).
Conclusions
A wildfire risk map of Lebanon was developed by identifying
and mapping wildfire hazard and wildfire vulnerability and
by employing various sets of geospatial data of Lebanon. Our
results present a systematic and integrated approach for as-
sessing the spatial variability of wildfire risk.
Evaluating the quality of the classification results of wild-
fire hazard, we found that the distribution of burned areas
over 13 years corresponds well to the fire hazard classes we
identified. However, a larger temporal extent of fire datasets
are needed for improved assessment of the results.
Overall, the use of
GEOBIA
provided a better understand-
ing of the spatial variability of fire risk across Lebanon,
information critical for developing effective fire preven-
tion policies and adaptation strategies. Important next steps
include incorporating wildfire risk data with daily fire danger
maps to more accurately predict the spatially explicit risk of
fire ignition and spread.
Acknowledgments
This material was published in association with the project
“Towards a Better Assessment and Management of Wildfire
Risk in the Wildland-Urban Interface in Lebanon: Gaining
from the US experience” supported by the Partnerships for
Enhanced Engagement in Research (
PEER
), sponsored by
US-
AID
. The contents do not necessarily reflect the views of
USAID
or the United States Government.
(a)
(b)
(c)
Figure 5. Subset maps of (a) wildfire hazard, (b) vulnerability, and (c) risk.
Figure 6. Spatial distribution of wildfire risk.
PHOTOGRAMMETRIC ENGINEERING & REMOTE SENSING
June 2015
505


