allowed the generation of a very detailed layer of polygons
eliminating visual interpretation subjectivity in boundary
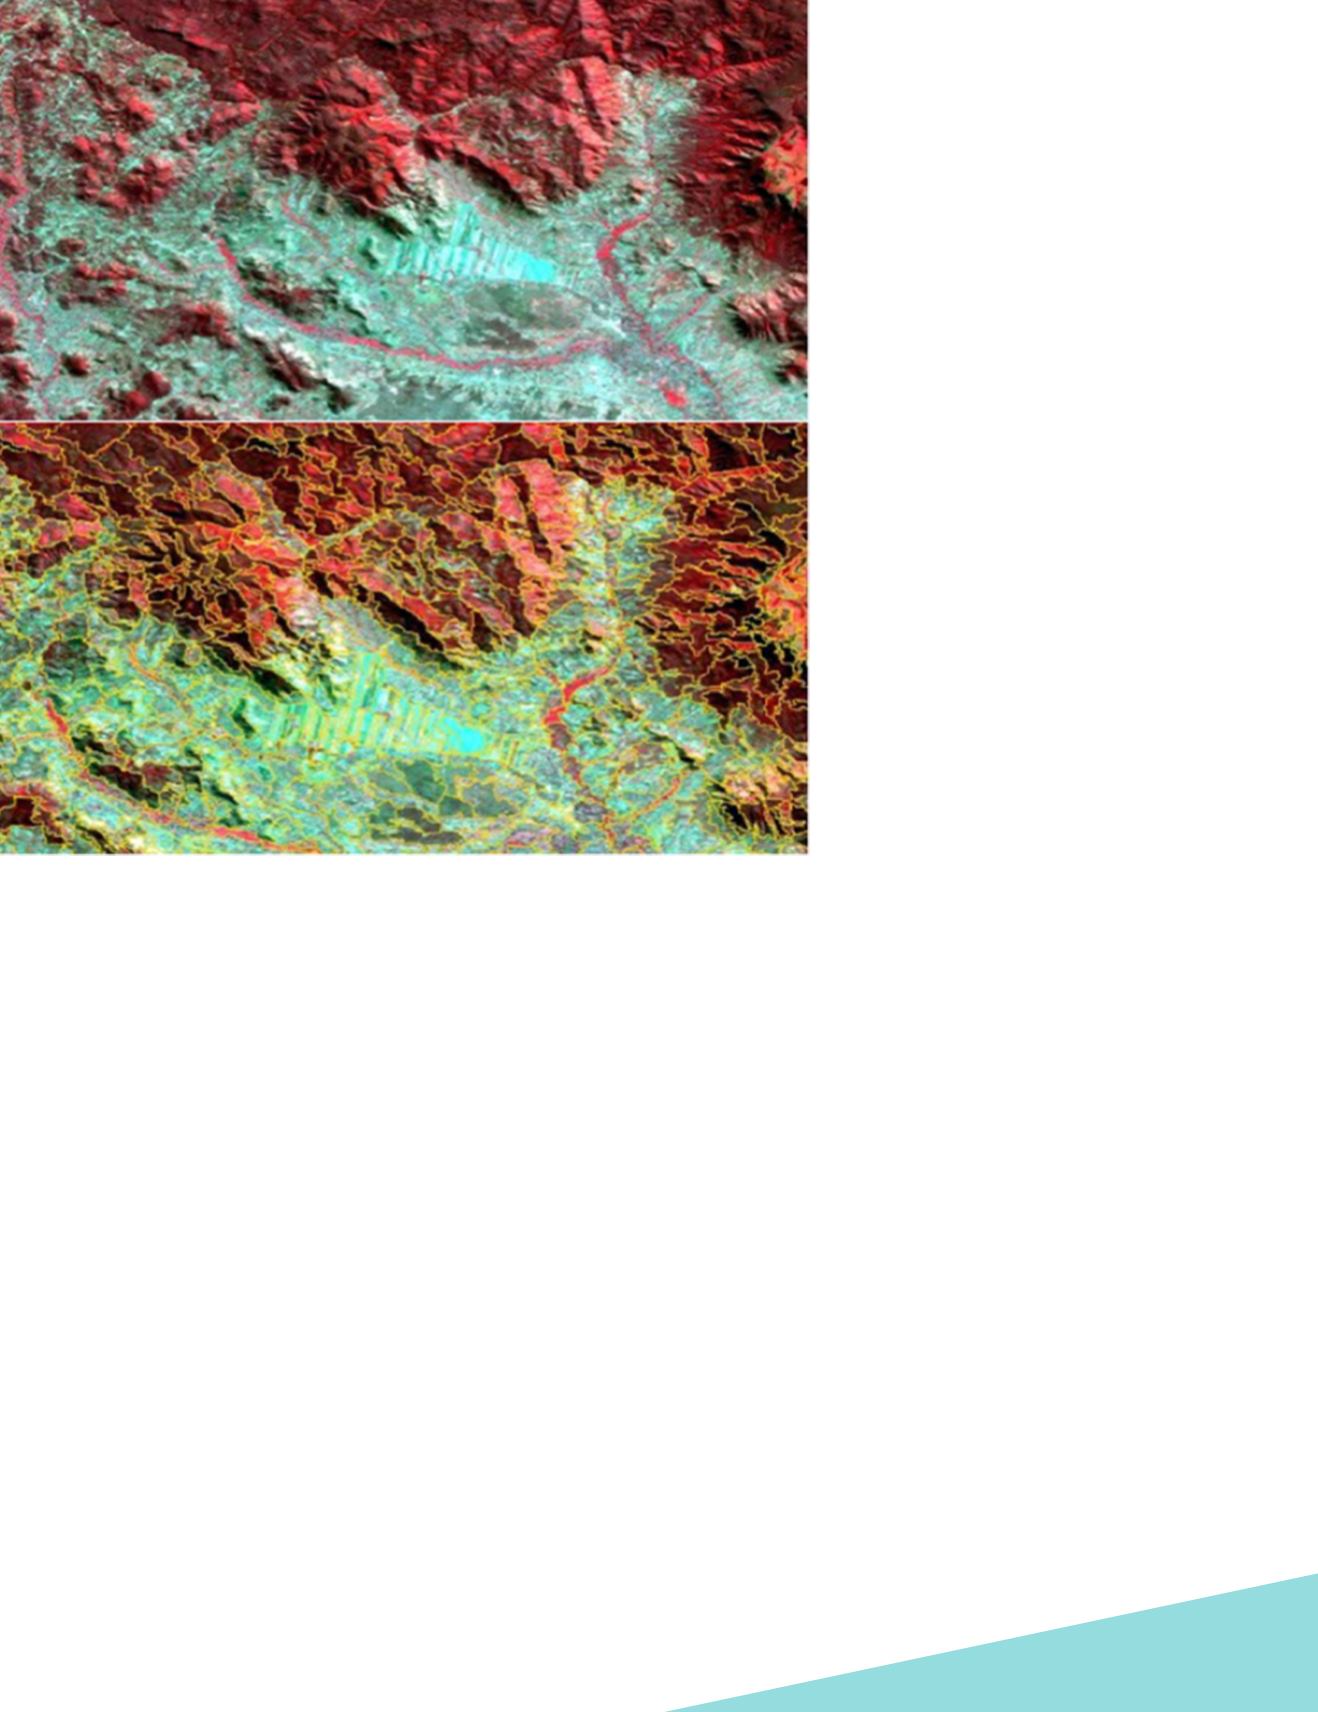
delineation. This effort created over 230,000 image objects
for Malawi which were visually interpreted by Malawian
national experts. Figure 5 is an example of the segmentation
polygons. This is an interesting combination of object based
machine processing and visual interpretation.
The LULC maps produced by the other three organizations
for Malawi also had at one level or another a visual inter-
pretation component. The JICA method applied unsuper-
vised or clustering of the imagery and then visual identifica-
tion of the clusters. The USAID procedure was a traditional
pixel based supervised spectral signature extraction and
application of a decision rule but then had a visual review
and editing to obtain a final classification. The World Bank
approach was an entirely traditional visual interpretation
approach using spaceborne images. Unfortunately, and per-
haps not surprisingly, the statistical results for these four
efforts were very different. The national results for forest
cover varied from 18 to 29% and for agriculture from 41 to
54% for the same year (Haack et al. 2015).
D
iscussion
and
C
onclusions
Remote sensing as a data source for
many disciplines has expanded and
continues to do so. This expansion has
included a tremendous increase in
the number of orbiting platforms, the
relatively new use of UAVs as well as
the continued use of airborne platforms.
In parallel to the increase in platforms
has been an increase in sensor types
and range of applications. Use of remote
sensing data has grown exponentially as
it has become more frequently available
on line and at no or low cost. This dra-
matic increase in data use underlines the
importance of data policy – the rules that
dictate who can get what imagery (or
other geospatial data) at what cost and
under what circumstances. Sears (2001)
found that cost recovery policies adverse-
ly affected the level of use of geospatial
data. Ryerson and Peanvijarnpong (2007)
found the same thing. Sears also found
an inverse relationship between the lev-
els of cost recovery fees charged and the
growth of the geospatial industry in the
US, Canada, and Australia. The higher
the fees, the lower the growth of the geo-
spatial industry.
The role of remote sensing data is to provide accurate spa-
tial information and there are two general methods for infor-
mation extraction, visual and machine. Frequently, how-
ever, those two methods are combined in many operational
efforts. Visual information extraction is extremely important
both independently and in combination with machine meth-
ods. The visual approach is not only employed for traditional
aerial photography, but also for many other sensors. For
example, in calibration and validation of many projects,
visual interpretation is often used. Many change detection
methods begin with machine methods to locate potential
areas of change but then an analyst visually determines the
significance and type of change.
As the community prepares the future workforce in remote
sensing information extraction in university or college cours-
es or through in-service training, it is important that visual
interpretation be a significant component of that prepa-
ration. Generally, that exposure should begin with aerial
photography, often for a location known to the analyst and
then expands to other sensors and enhancement procedures.
The best, and perhaps only, method to develop viable visual
interpretation competency is by experience with multi-
ple images. Recent advances in remote sensing systems
should allow significantly better understanding of the
804
December 2017
PHOTOGRAMMETRIC ENGINEERING & REMOTE SENSING
Figure 5. Object oriented polygons for visual interpretation of land use/land cover from
Landsat imagery for Malawi.


